As a startup founder or small business owner, the last thing you want is to spend hours analyzing complex financial spreadsheets. What you need instead is a tool that will provide you with actionable insights in real time so that you can make informed decisions quickly and confidently.
That's where intuitive financial dashboard software steps in! It's easy to get lost in a sea of financial management solutions. That's why we've picked some of the best and most user-friendly tools suitable for those who are not financial experts. Keep reading to get a detailed overview of their features and pricing and find the right tool for your business.

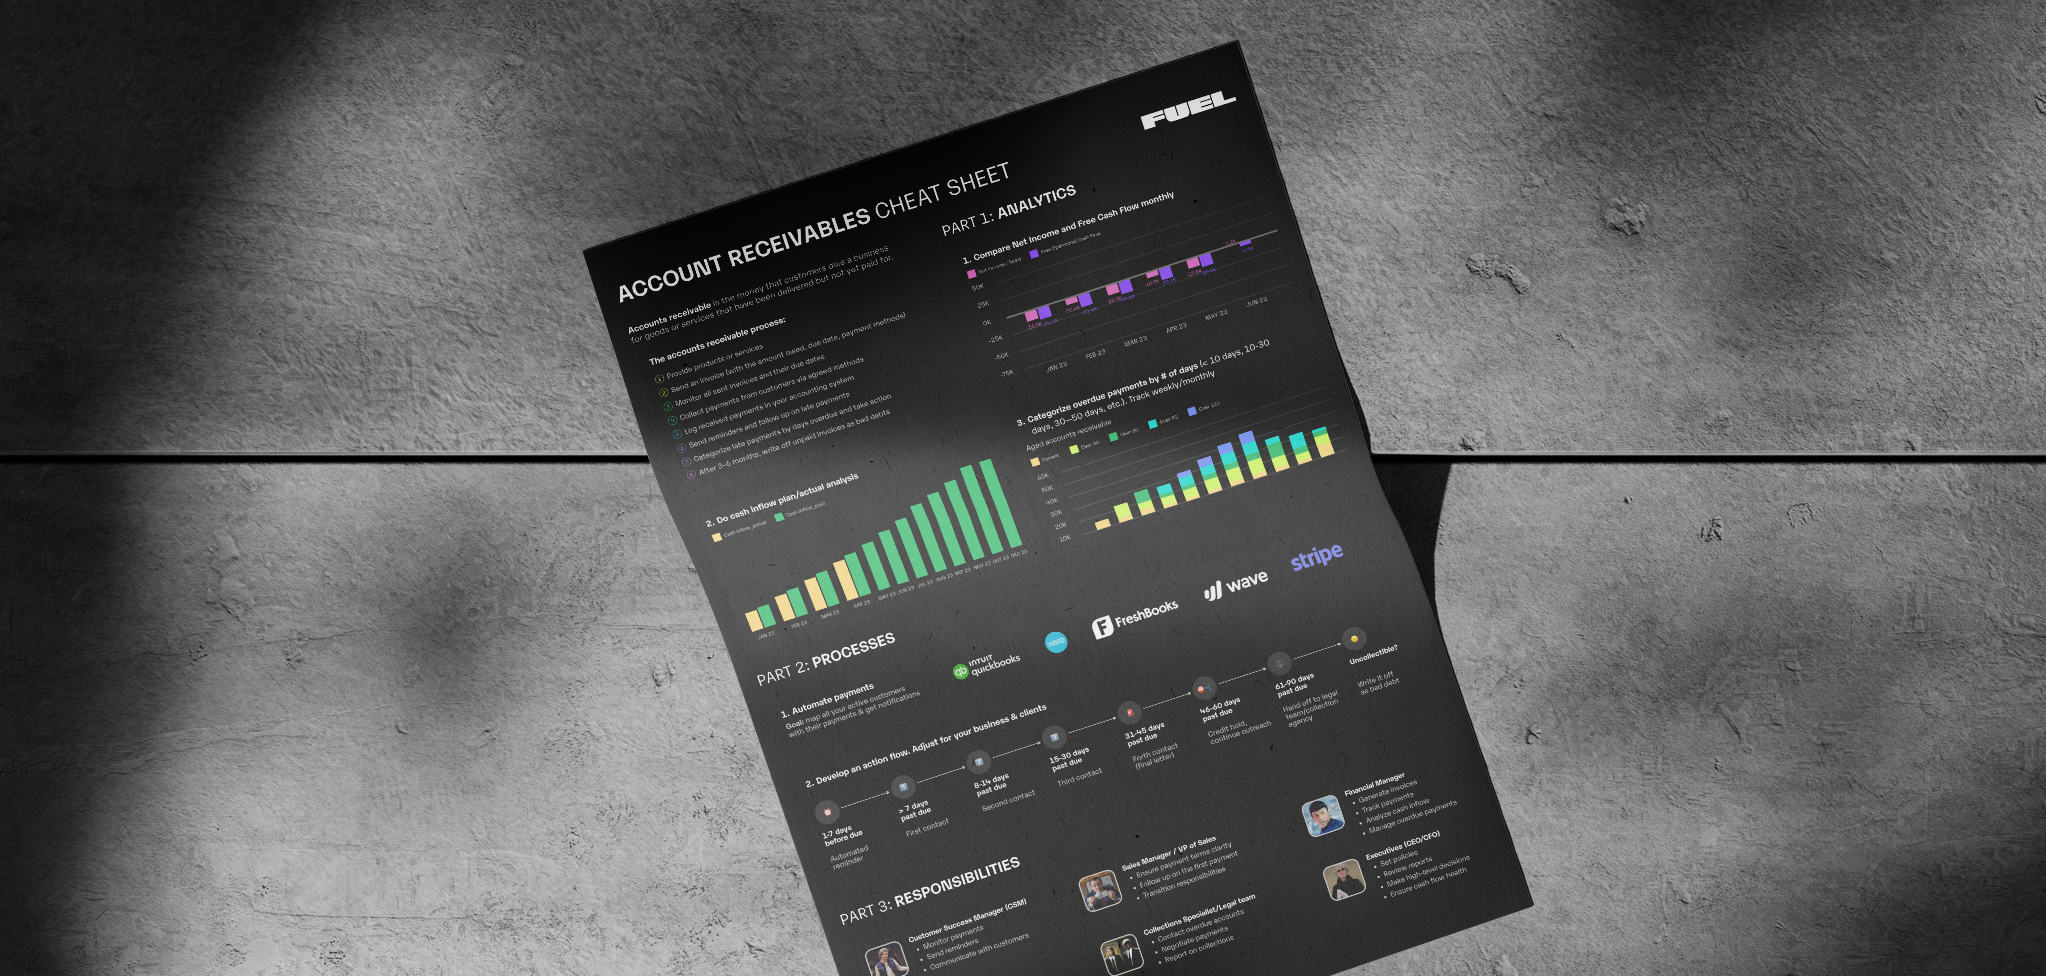
Source: Fuelfinance.me
Fuelfinance is a user-friendly cloud-based tool made for small business financial management. It helps with everything from budgeting and planning to tracking, reporting and financial forecasting for startups.
This makes it an excellent choice for startup founders and small business owners, as it comes with unlimited support from our financial experts who function like your own outsourced CFO.
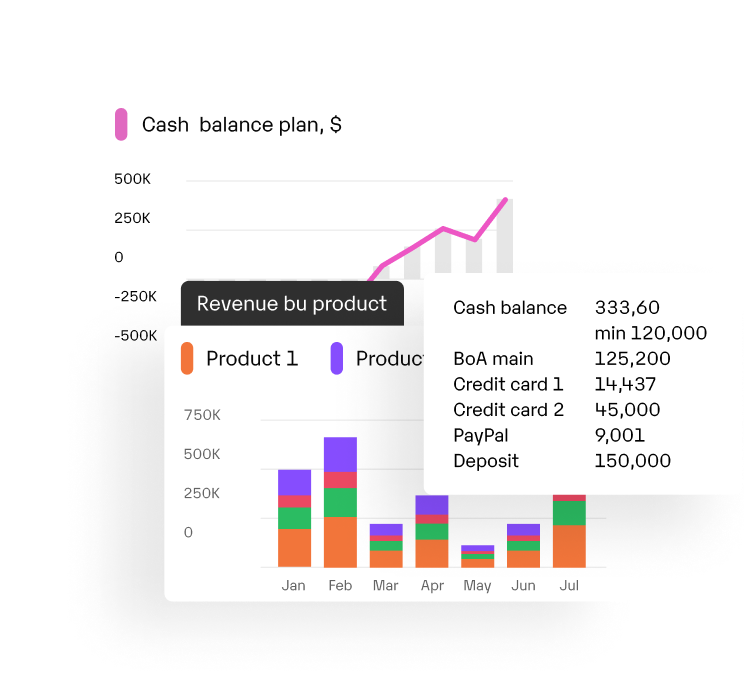
One of the most valuable features is its all-in-one financial dashboard. Fuelfinance gives you a clear overview of all the critical metrics you need in one spot, with real-time updates on how your business is doing. It also suggests key SaaS metrics to keep an eye on based on your startup financial model.
Here's what it also includes:
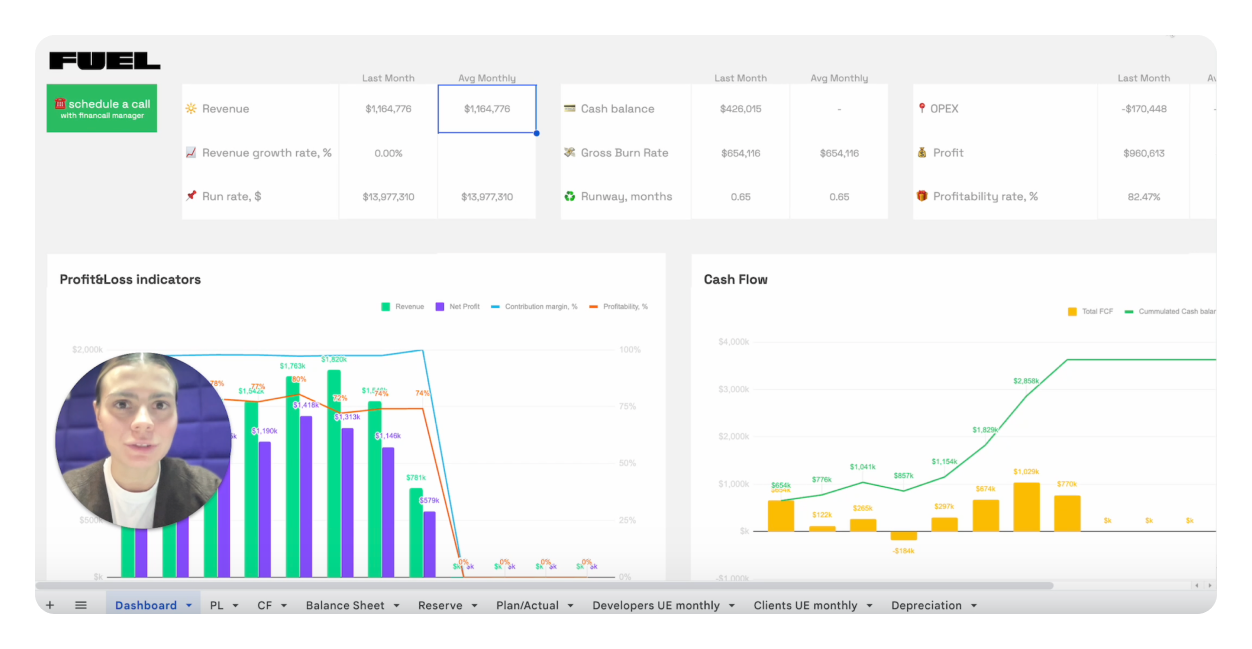
Source: Fuelfinance.me
On our dashboard, you can see all the key metrics that you need to track, such as your revenue, expenses, cash balance, P&L indicators and GMV – important metrics for marketplaces.

Source: Fuelfinance.me
ALT: Fuelfinance dashboard with monthly KPIs
These dashboards automatically update, providing you with real-time data, so you don't have to worry about updating your information. There are other reports that you fill in, such as P&L, cash flow and balance sheet.
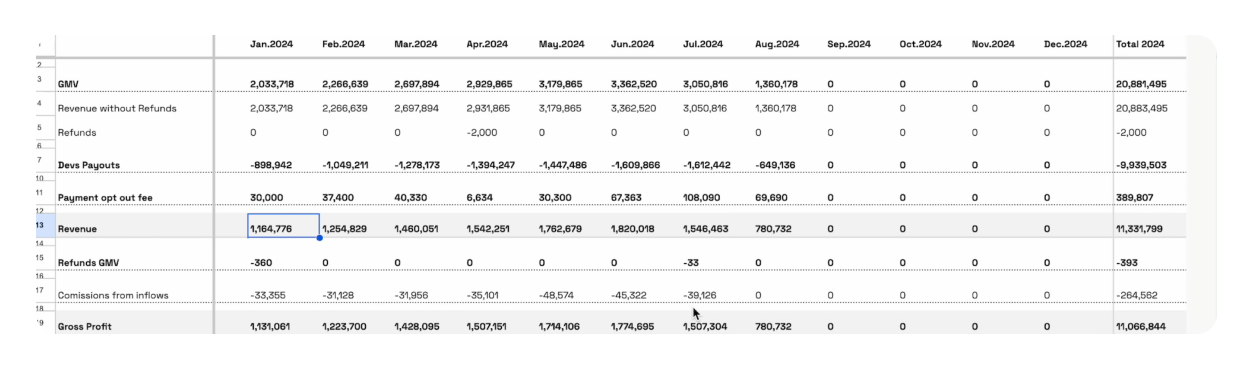
Not only can you can track your current data but you can also do some planning! Below, you can see green and red boxes. The green ones mean that you've achieved your goals, while red ones mean you haven't fulfilled your plans.

Source: Fuelfinance.me
Finally, there are two types of Unit Economics you need to calculate for all marketplaces – UE from sellers and buyers. On this template, everything is calculated automatically based on your previous reports.
There are only two lines you need to add – the number of new sellers/buyers and total hours. Those lines are marked by a handwriting icon next to them.
Source: Fuelfinance.me
If you're new in business and your startup hasn't secured funding yet, here's our Bootstrap plan to help you start:
After trying the Bootstrap plan, you can upgrade to one of our other options based on your needs:
Capterra: 5
G2: 4.9
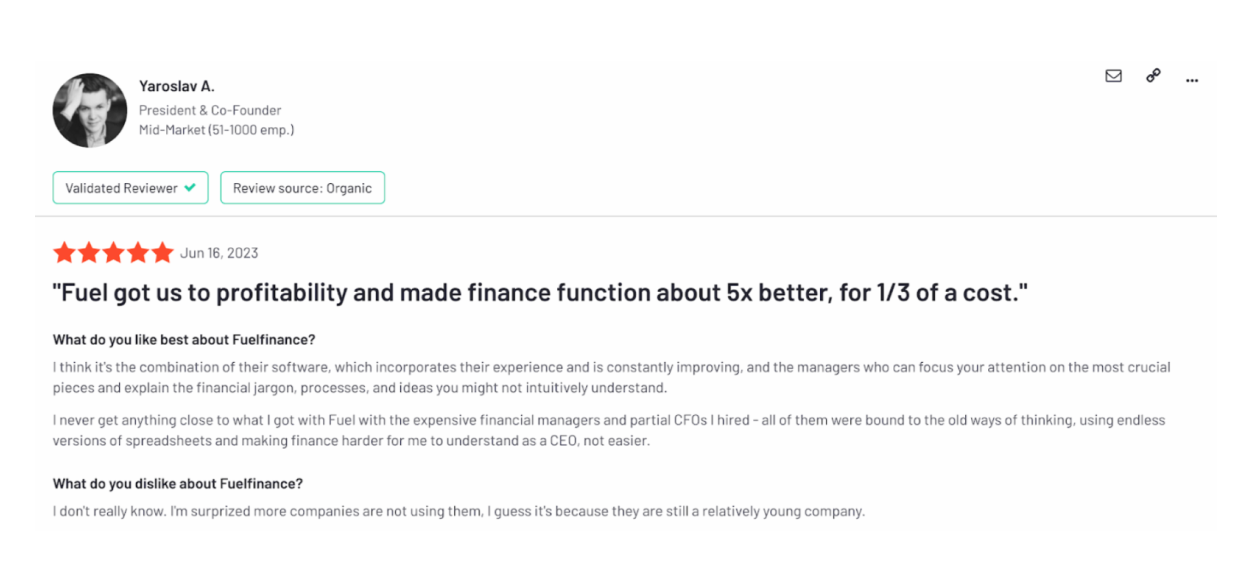
Source: G2.com
Source: G2.com
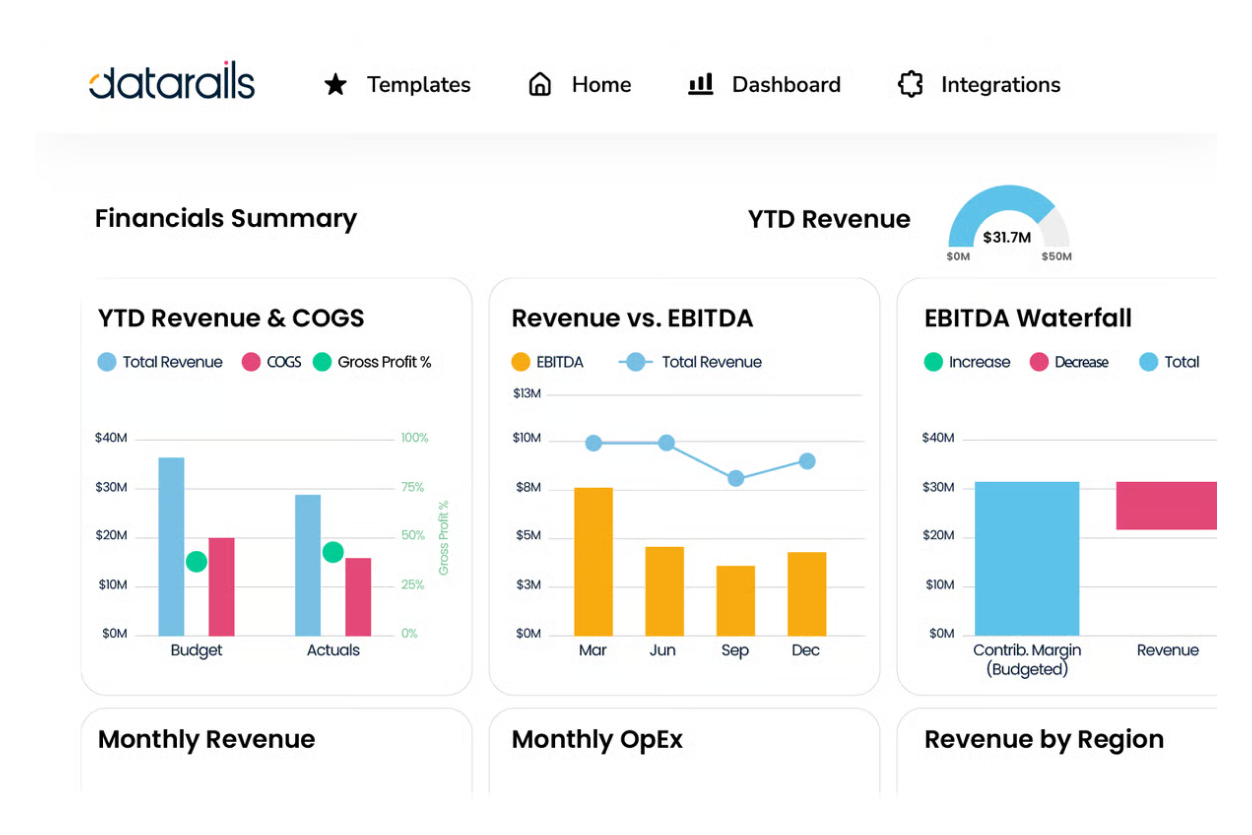
Datarails is a financial reporting software for Excel users who want to automate their financial planning within spreadsheets. It's mainly used by large companies for budgeting and analysis.
The Dashboard feature creates interactive charts for quick analysis and presentations. It adjusts with filters and updated data and you can also create custom metrics. Everything is based on the drag-and-drop principle so you can easily create custom reports.
You can also share dashboards via automated emails, PDFs or links.
Here are some other features:
Datarails doesn’t list pricing on their website because they provide custom quotes based on your needs and the number of users. To receive a quote you have to fill out a form on their site.
Keep in mind that the tool is primarily designed for large companies which makes it a bit pricey. If you’re seeking something more budget-friendly, consider checking out Datarails competitors.
Capterra: 4.8
G2: 4.7

Source: G2.com
Source: G2.com
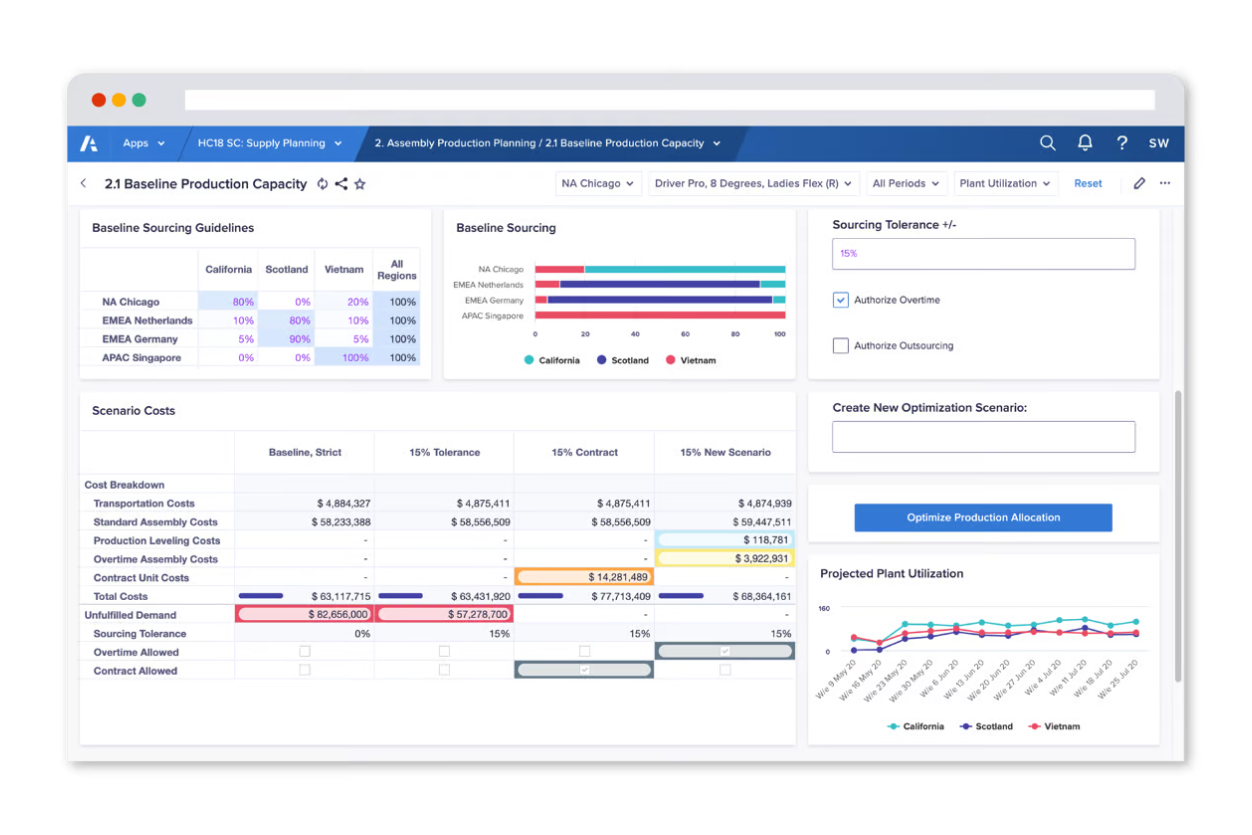
Anaplan is a versatile platform for managing corporate performance and financial planning. While it's designed for businesses of all sizes, it’s mainly aimed at large enterprises. It can be used for tasks like revenue planning, workforce planning and operational expense planning.
Anaplan's dashboard features allow you to create customized dashboards that can adapt to the needs of different teams and departments. The tool offers four different types of dashboards:
Here are some other features:
Anaplan doesn't provide pricing details on its website, as the pricing depends on the features you need and the size of your company. According to some users, it's among the pricier financial tools, so you may want to check out Anaplan competitors.
Capterra: 4.3
G2: 4.6

Source: G2.com
Source: Capterra.com
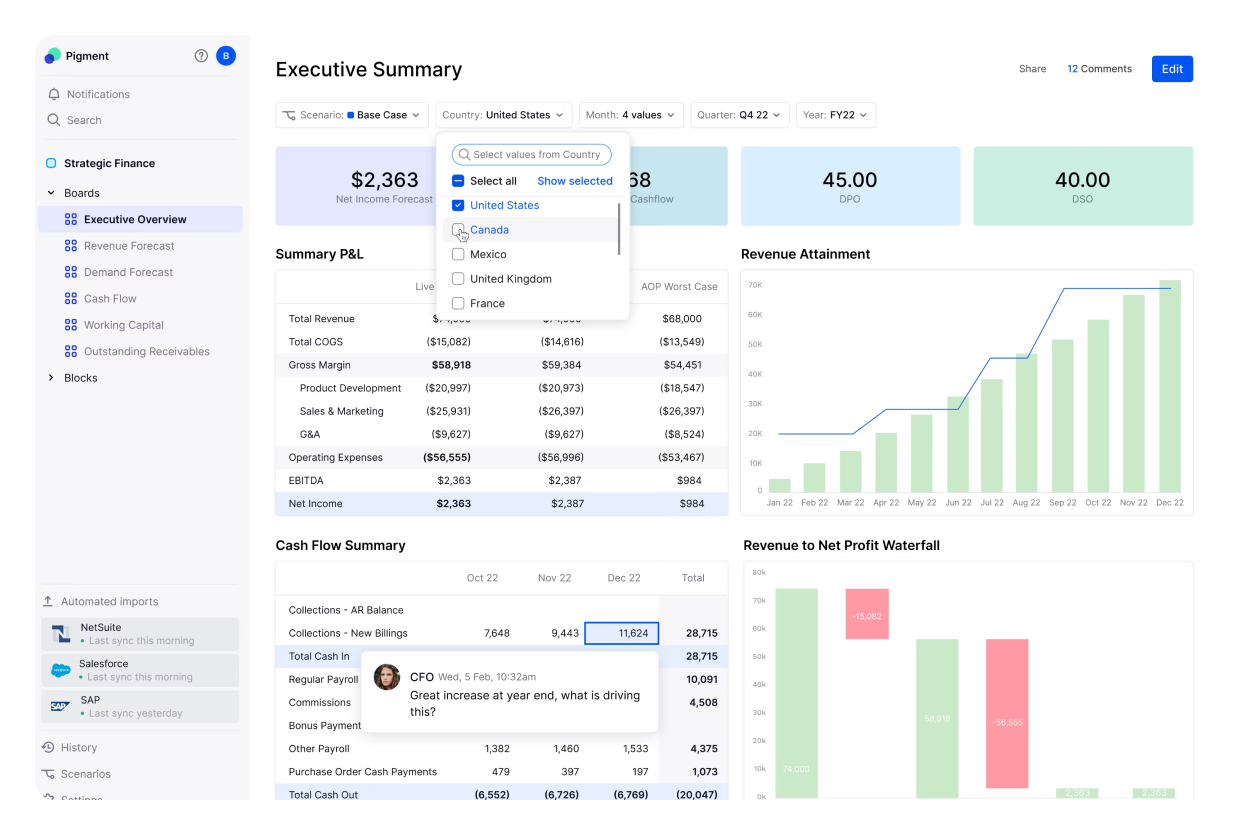
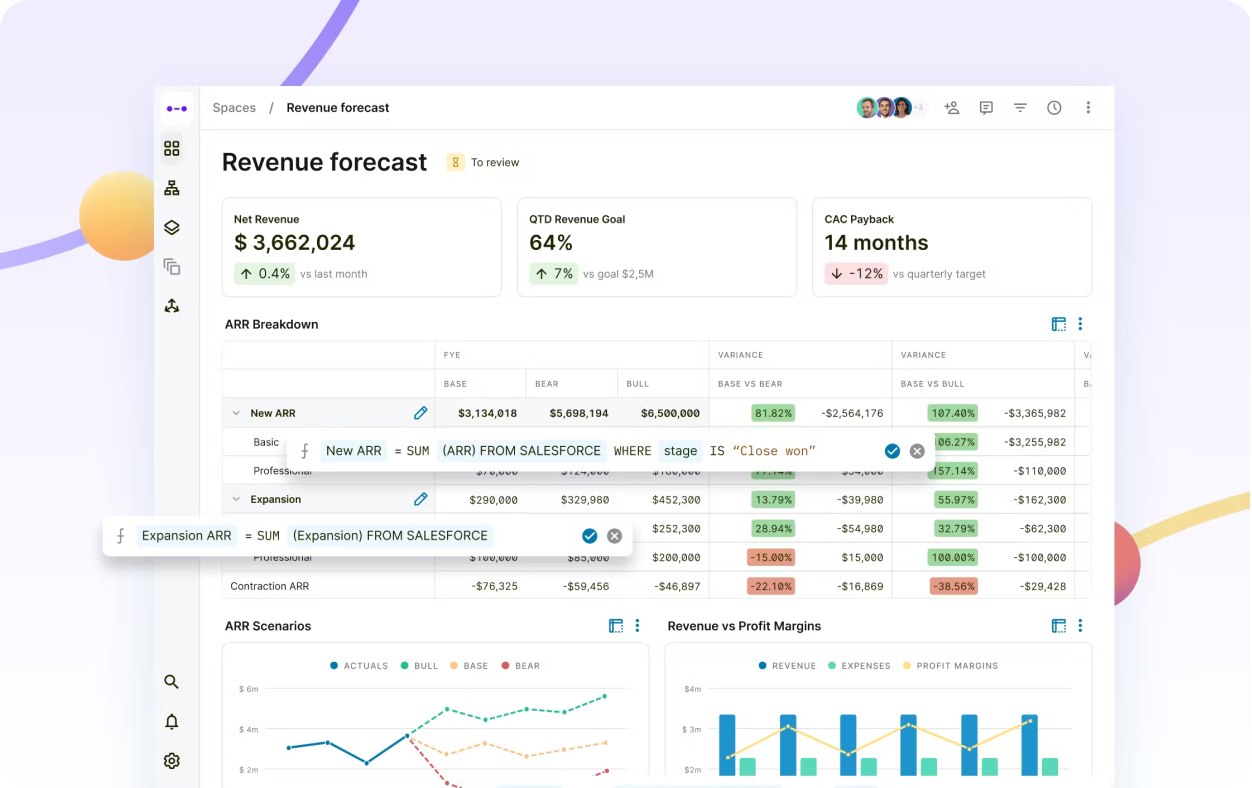
Pigment is a business planning tool that brings together people, data and processes allowing you to plan both your budget and human resources in one place.
Pigment lets you create and customize your dashboards with colorful graphs and tables. They offer different kinds of boards, such as revenue and demand forecasts, the company's cash flow dashboard, working capital ratio etc.
Here are some other features:
The tool doesn’t provide pricing on its website and you have to request a custom quote based on your company's size.
Pigment mainly targets mid- and large-sized businesses, so if you’re a small business owner or startup founder, consider looking at some Pigment competitors.
Capterra: N/A
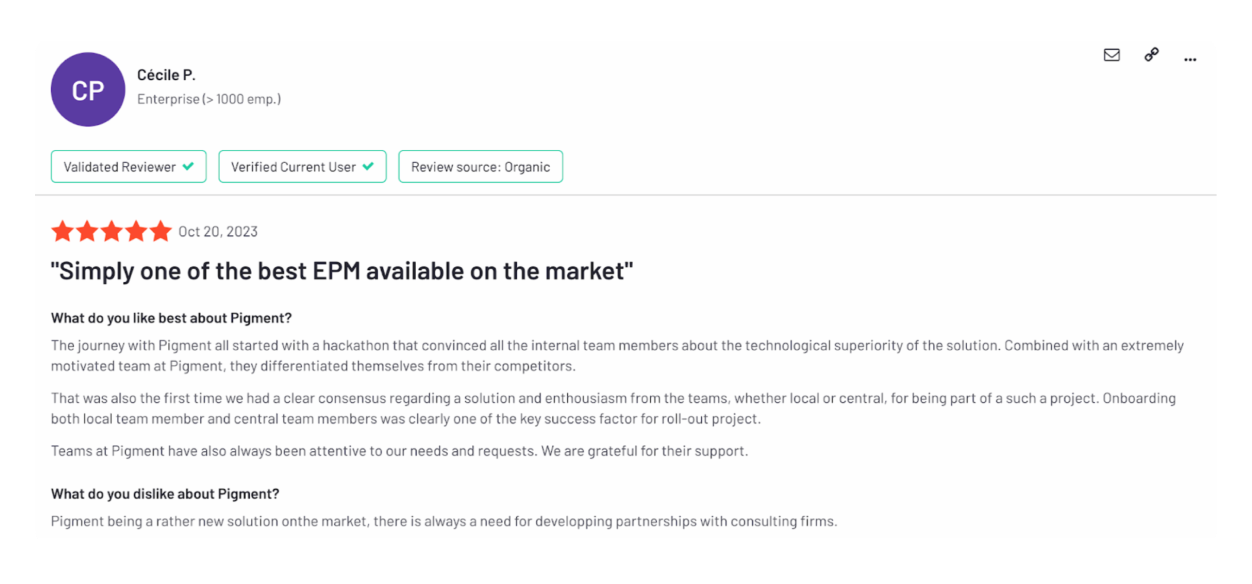
G2: 4.6
Source: G2.com
Source: G2.com
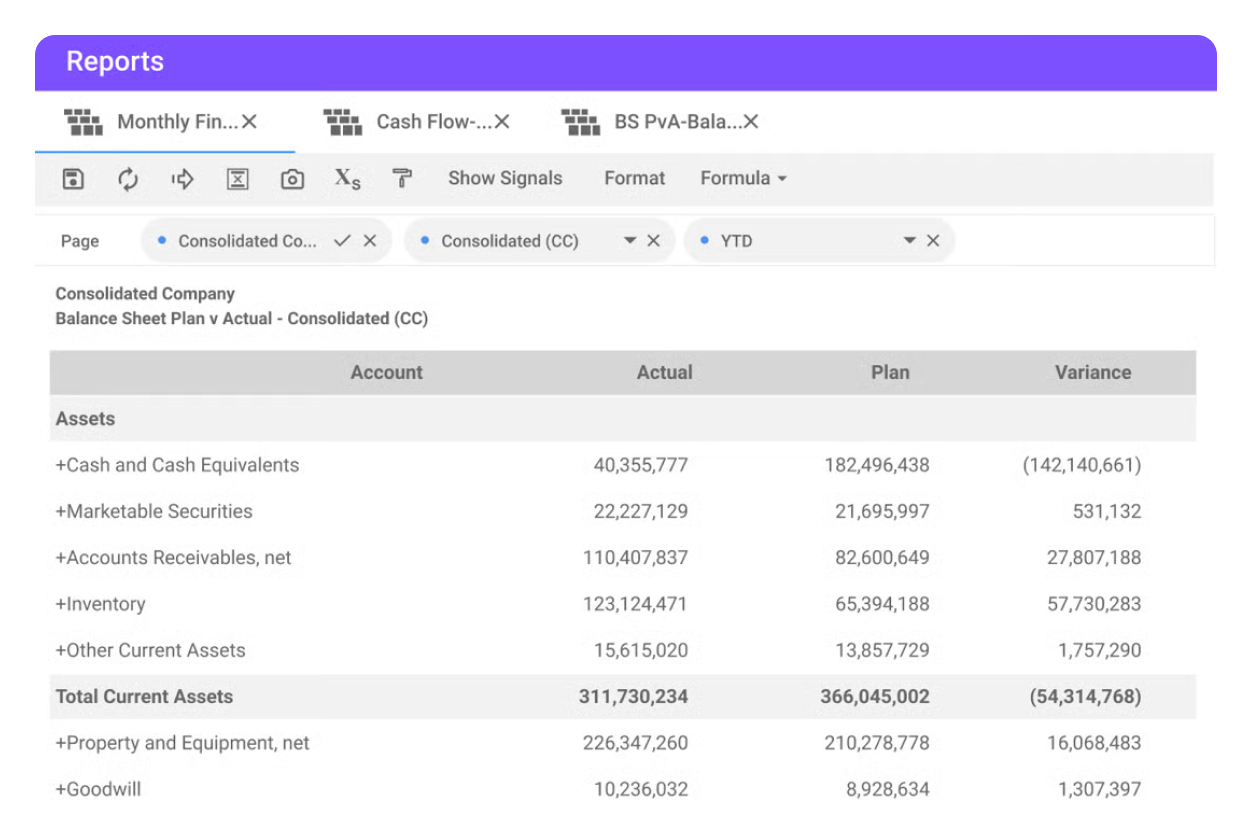
Planful is one of the comprehensive business planning tools that can be used by finance, sales, HR and accounting teams.
You can create custom dashboards for different departments using a simple drag-and-drop interface. The color-coding system enables you to quickly spot trends and identify performance issues by combining financial and operational data in one place.
Here are its key features:
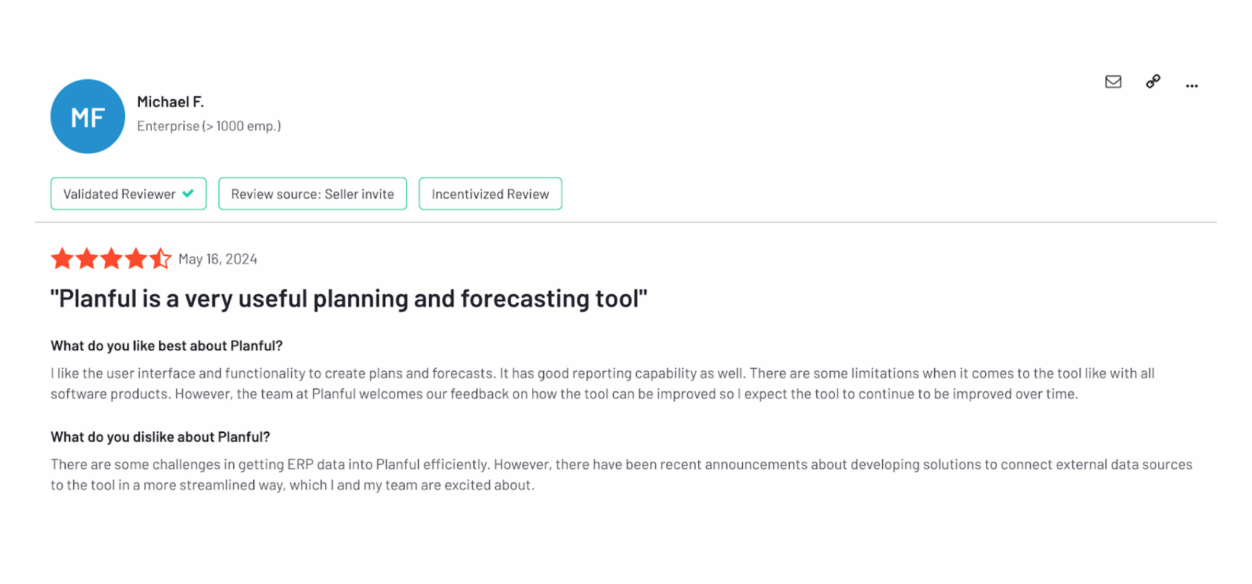
Planful doesn’t show its prices online, but some reviews suggest it may be more affordable than other business planning tools like Pigment and Anaplan. For a custom quote, you have to contact their customer support.
Capterra: 4.2
G2: 4.3
Source: G2.com
Source: Capterra.com
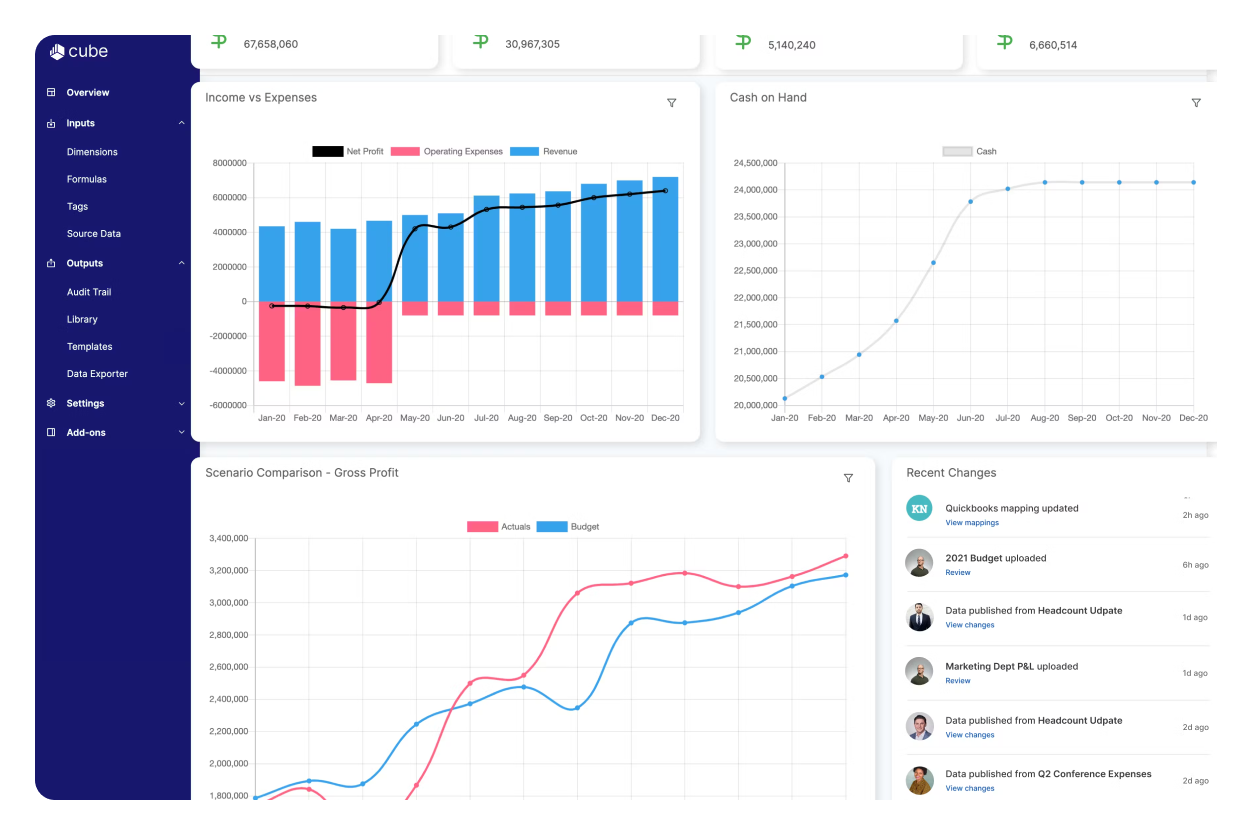
Cube is a financial planning tool that integrates with Microsoft Excel allowing you to easily analyze your existing spreadsheets, similar to Datarails (see also: Datarails vs. Cube). If you don’t want to use Excel or Google Sheets, you can still use Cube on its own.
Cube lets you create dashboards that visually present your data, making it easier to track key performance indicators. Admins can build and share custom dashboards tailored to specific users or teams, featuring charts and questions that support planning and analysis. For example, there is a CAGR dashboard that lets you analyze the time value of the money function of the underlying finance analytics platform, compare growth rates of different segments and prioritize resources.
Here are its key features:
Cube offers three plans:
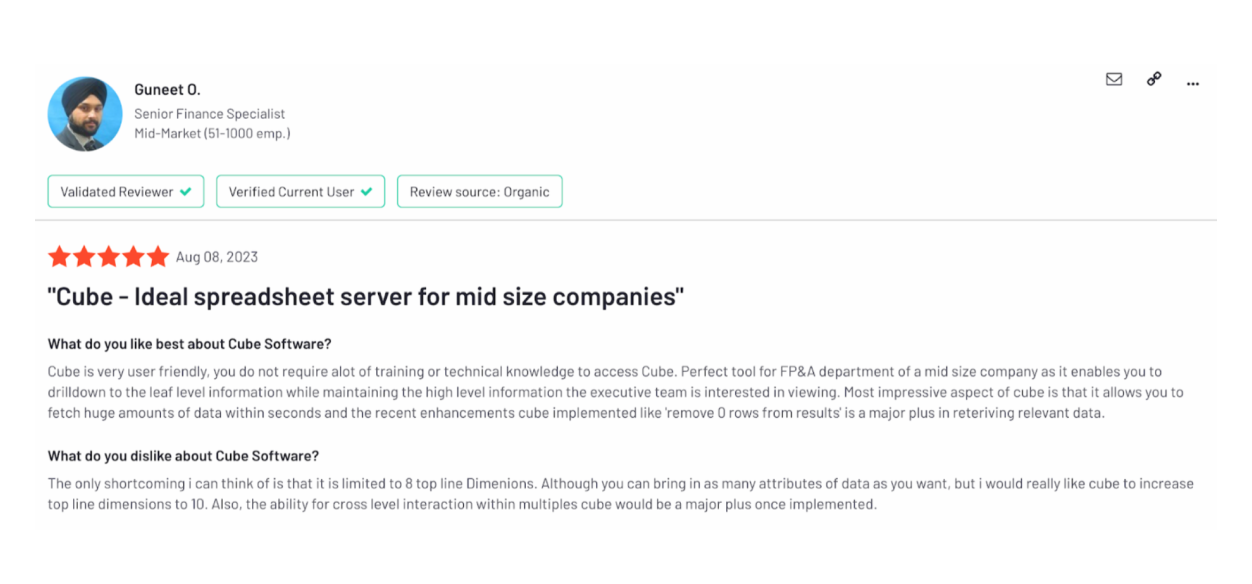
Capterra: 4.6
G2: 4.5
Source: G2.com
Source: Capterra.com
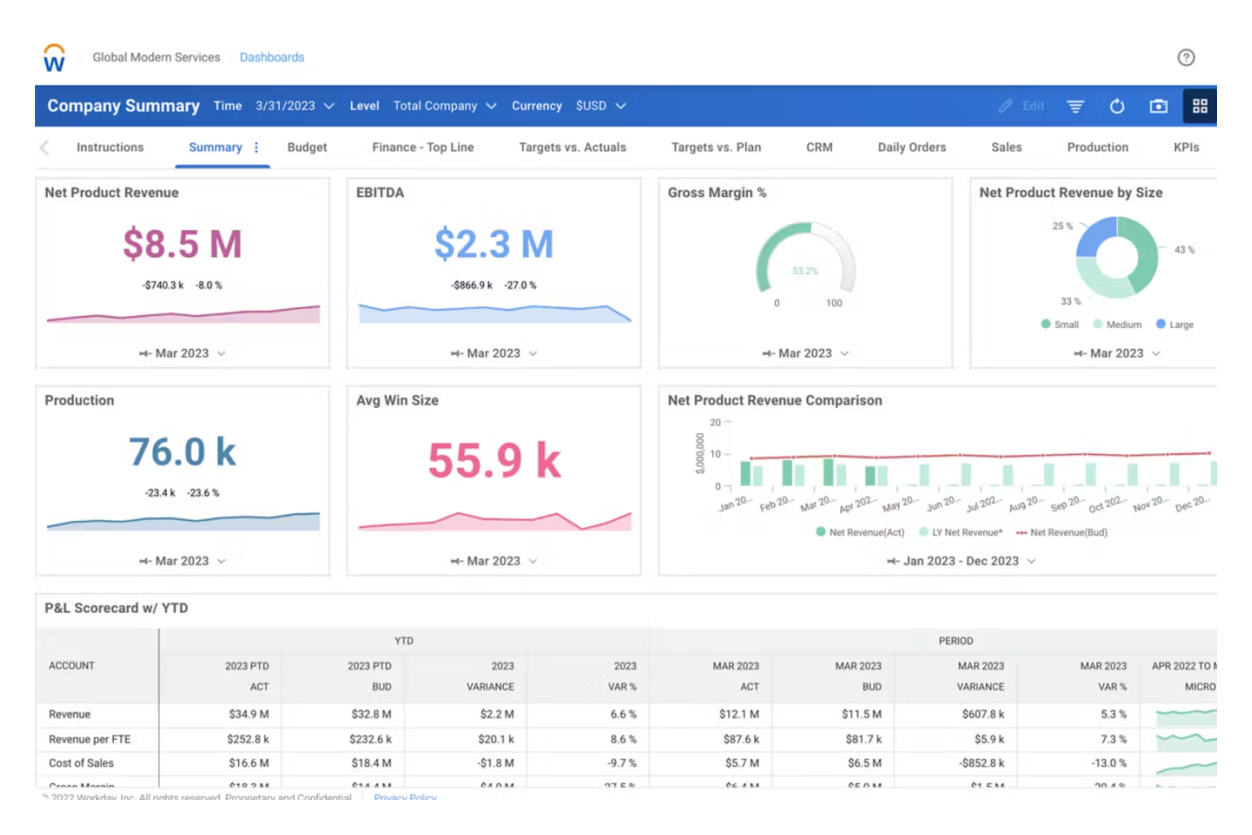
Workday helps enterprise-level teams quickly and accurately create budgets, workforce plans and financial models.
Workday’s dashboards keep all data in one place, helping teams make informed, data-driven decisions. They provide easy access to various reports on key metrics and different scenarios. You can drill down into details and elaborate.
Here are its main features:
Workday doesn’t list its prices online, but you can choose whether you want only adaptive planning (a cheaper plan) or to combine planning and consolidating financial data. There's a 30-day free trial.
Capterra: 4.5
G2: 4.2
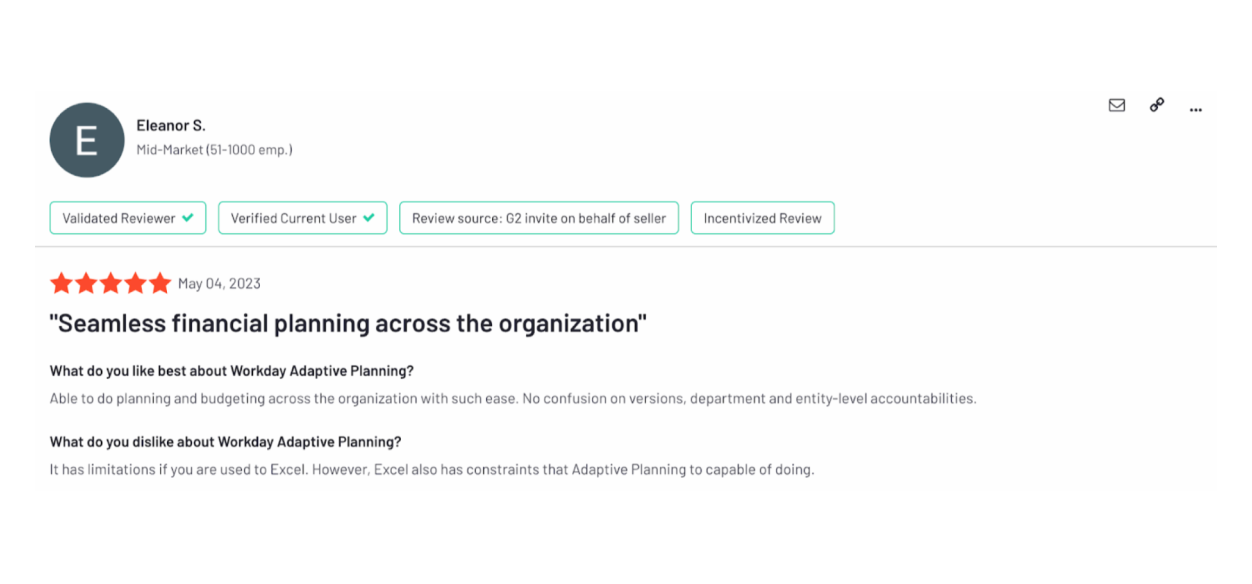
Source: G2.com
Source: Capterra.com
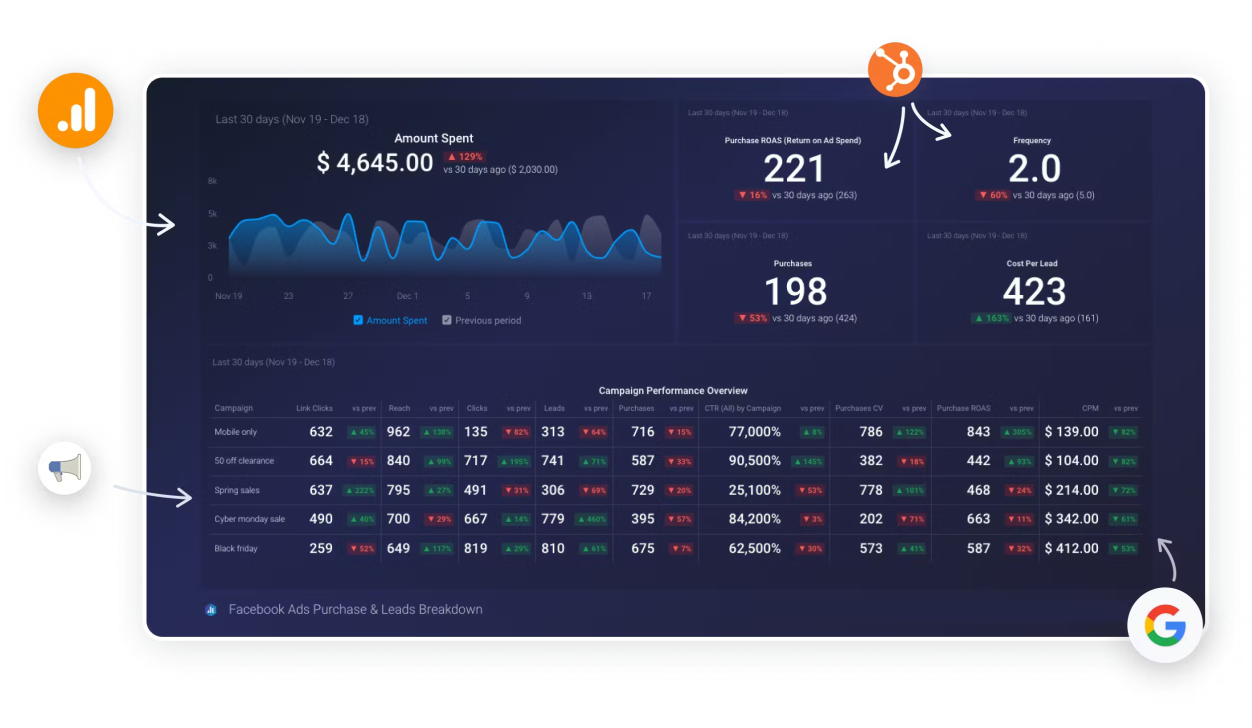
Databox is a user-friendly business analytics tool that has a wide range of purposes, but it can be used by your finance team as well. It's great for visualizing large volumes of data and combining different data sources.
It comes with hundreds of pre-made financial dashboard templates that include all the most common financial KPIs such as ROI, CAC, LTV, ROAS and even conversion rates for your marketing and sales team. All you have to do is choose a template and integrate data and you'll get a graphic visualization of your financial performance.
Here are its key features:
Databox offers five pricing plans:
There’s also a 20% annual discount available.
Capterra: 4.6
G2: 4.4
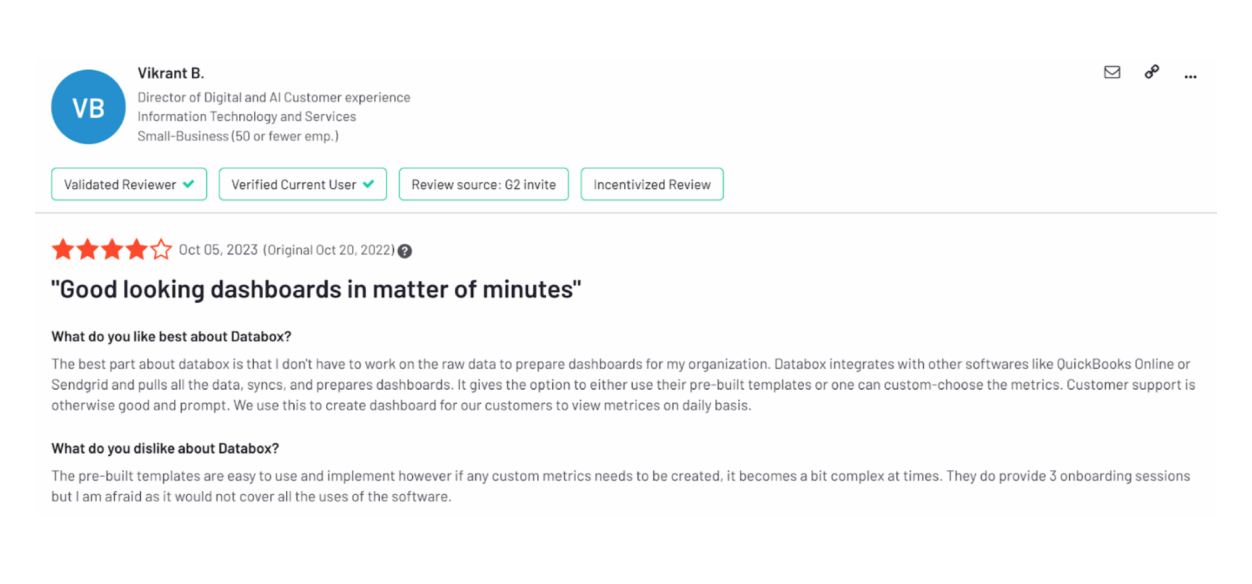
Source: G2.com
Source: Capterra.com
Abacum is a financial planning tool that can be used for forecasting, budgeting, reporting and analysis.
Its interactive dashboards combine financial and operational metrics like cash flow, revenue, ROI and others and update in real-time. A thing that makes this financial modeling software stand out are its AI summaries. If you don't have time to do a detailed financial analysis, you can generate a quick summary and get insights into the performance of each chart and table.
Here are its key capabilities:
Abacum offers three pricing plans but the prices are not listed on the website:
Capterra: N/A
G2: 4.8

Source: G2.com
Source: Capterra.com
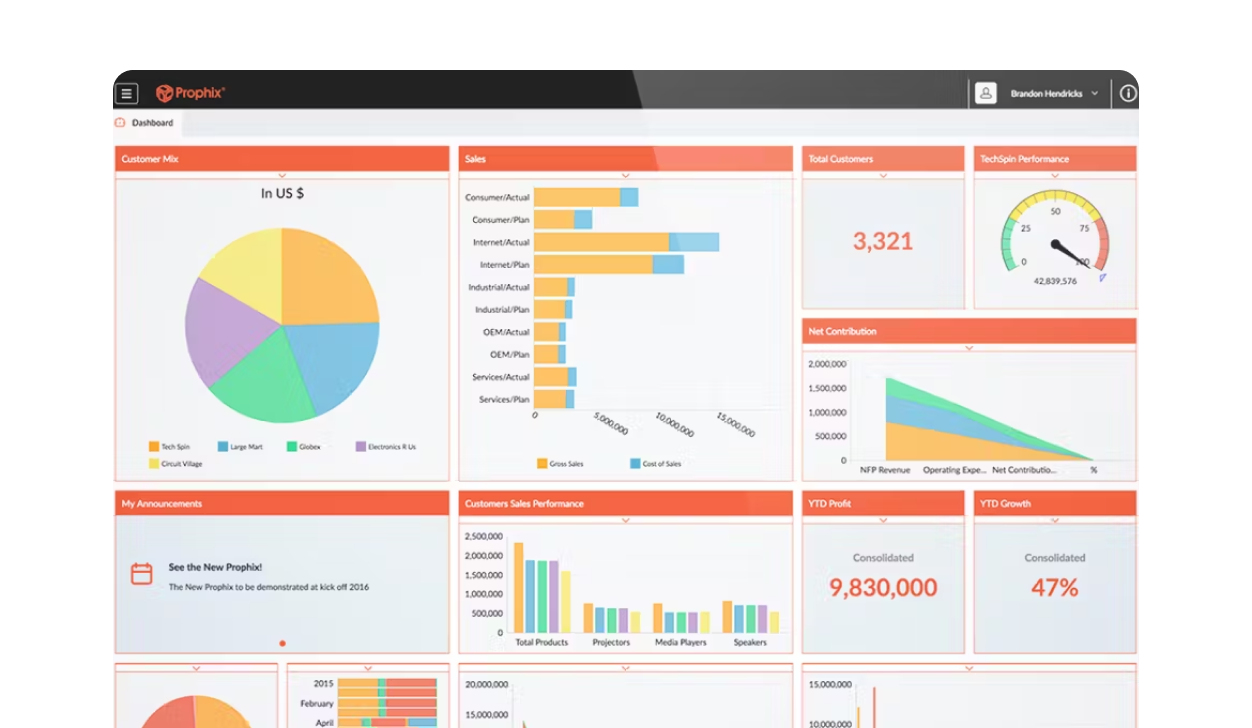
Prophix is a financial tool that can be used for FP&A but also for financial consolidation and closing. It stands out for its security features.
This tool lets you create a custom dashboard from scratch. You can start with a blank dashboard, add tiles for various metrics and adjust their size or position as needed.
If you don't like tables that look like Excel, you can transform your data into graphic visuals with only one click.
Here are its other features:
Prophix doesn't list prices on its website as all plans are custom-made.
Capterra: 4.6
G2: 4.4
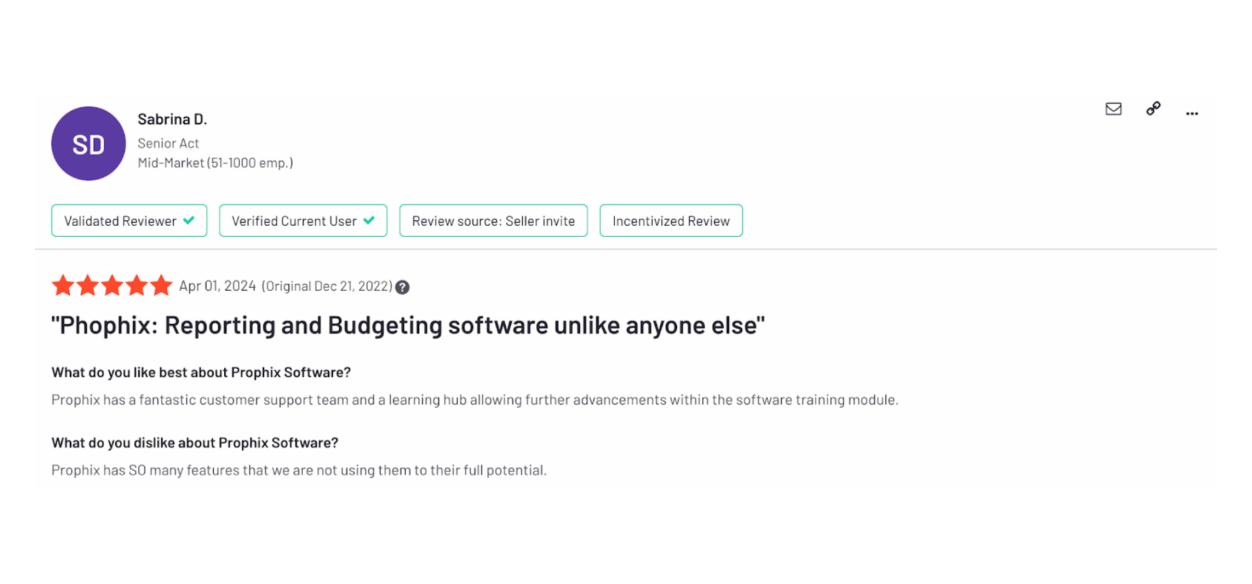
Source: G2.com
When looking for the best FP&A software, you should consider three key aspects: features, pricing and integrations.
These are the main features to look for:
It's essential to find the balance between features and costs. Even though most financial dashboard software tools don’t show pricing upfront, you should always check who the tool is aimed at – small and medium businesses or enterprises. If you're a small business owner, you should be careful not to end up paying a higher price for a tool with advanced features for financial professionals that you don't necessarily need at the moment.
Here's a concise list of useful FP&A integrations:
PlatformKey featuresPricingBest forFuelfinanceAll-in-one dashboard
Financial planning and analysis
Advanced automation
Unit economics
Financial statements
Expert financial supportFree Bootstrap plan
Custom price for paid plansStartups and small businessesDatarailsFinancial reporting
Budgeting and forecasting
Scenario analysis
AI chatbot
Automated data collectionCustom priceExcel users who want to improve financial analysisAnaplanFinancial planning and modeling
Predictive insights
Machine learning and pattern spotting
Cross-team collaborative planning
Executive-level business intelligenceCustom priceEnterprises that want to combine financial and workforce planningPigmentBudget planning and forecasting
AI planning assistant
Financial reporting
Headcount planning
Sales capacity planningCustom priceCompanies that want to use the same tool for HR and financesPlanfulAccounting
Budget planning
Rolling forecasts
ML pattern recognition
AI-driven insightsCustom priceSales teams who want to track their performanceCube SoftwareFinancial modeling
Multi-scenario evaluation
Ad-hoc financial reporting
Driver-based planning
Performance reportingStarting at $1,500 per monthThose looking for a financial add-on for Excel or Google SheetsWorkday Adaptive PlanningBudgeting and forecasting
Driver-based plans
Scenario modeling
Workforce planning
Analytics and reportingCustom priceEnterprises looking for a comprehensive ERP toolDataboxFinancial forecasting
Financial benchmarking
Performance management
Custom reports
Metric Digest (weekly email updates)Free planPaid plans starting at $59 per monthThose looking for pre-made financial templatesAbacumReal-time reporting
Scenario modeling
Revenue and OpEx planning
AI summaries
Investor reportsCustom priceCompanies that want to track financial and operational metrics in the same toolProphixIntegrated business planning
Financial forecasting and analysis
Account reconciliation
Visual analytics
AI insightsCustom priceThose looking for a tool for integrated business planning
At Fuelfinance, we know that launching a business can be tough. The last thing you need is to deal with complex tools created for finance professionals.
That’s why we created a solution tailored for small businesses and startups, simplifying finance management for those without a finance background. With our user-friendly financial dashboards, you can gain clear insights into your business performance and keep a finger on your financial health.
All that comes with unlimited assistance from our financial experts who will suggest you financial metrics to track.
Book a demo call today to see how you can simplify your finances with our comprehensive dashboards.
READY FOR FINANCIAL
P😌ACE OF MIND?
See what Fuel can do
for your biz.
To build a financial dashboard, start by defining your goals and selecting key metrics you want to track, for example, gross profit, revenue and cash flow. Use charts for better visualization. Creating financial dashboards is much easier with a tool that comes with pre-made dashboards and templates.
The basic financial dashboard usually contains only key metrics like cash flow, revenue, expenses and profits, but the exact KPIs may depend on your business model.
It's an executive-level tool made for decision-makers that goes beyond daily financial reporting and includes more advanced financial metrics and insights, e.g., debt-equity ratio, risk analysis and strategic insights.
It depends on the size of your organization, but Fuelfinance is one of the best software for small businesses and startups as it combines accurate financial analysis and advanced automation with a user-friendly dashboard.