Managing business finances can feel like pushing a rock up a hill. When you pull reports from multiple sources, you end up buried in spreadsheets, trying to piece together the bigger picture — it never ends.
Financial dashboards are a cure for this chaos. A well-designed financial dashboard transforms raw data into clear, actionable insights by centralizing key metrics in one place. Instead of spending hours crunching numbers, you get real-time financial snapshots that help you stay on top of revenue, expenses and cash flow.
In this article, we'll explore 10 powerful financial dashboard examples that can help you optimize reporting, gain deeper financial insights and make better business decisions.
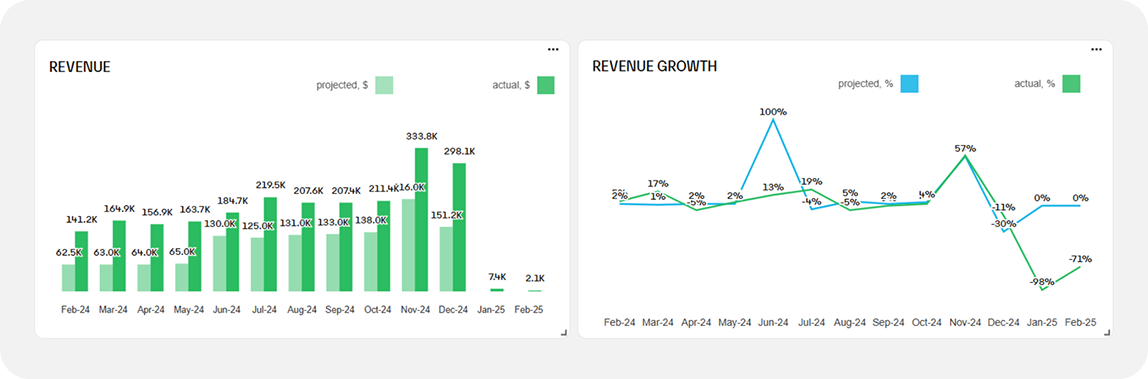
Fuelfinance is a financial dashboard software that centralizes your company's financial data, providing real-time insights into key metrics. It offers in-depth tracking of Profit & Loss (P&L), cash flow, financial projections, unit economics, revenue and expenses. This financial management tool uses AI forecasting to assist businesses in making informed financial decisions.
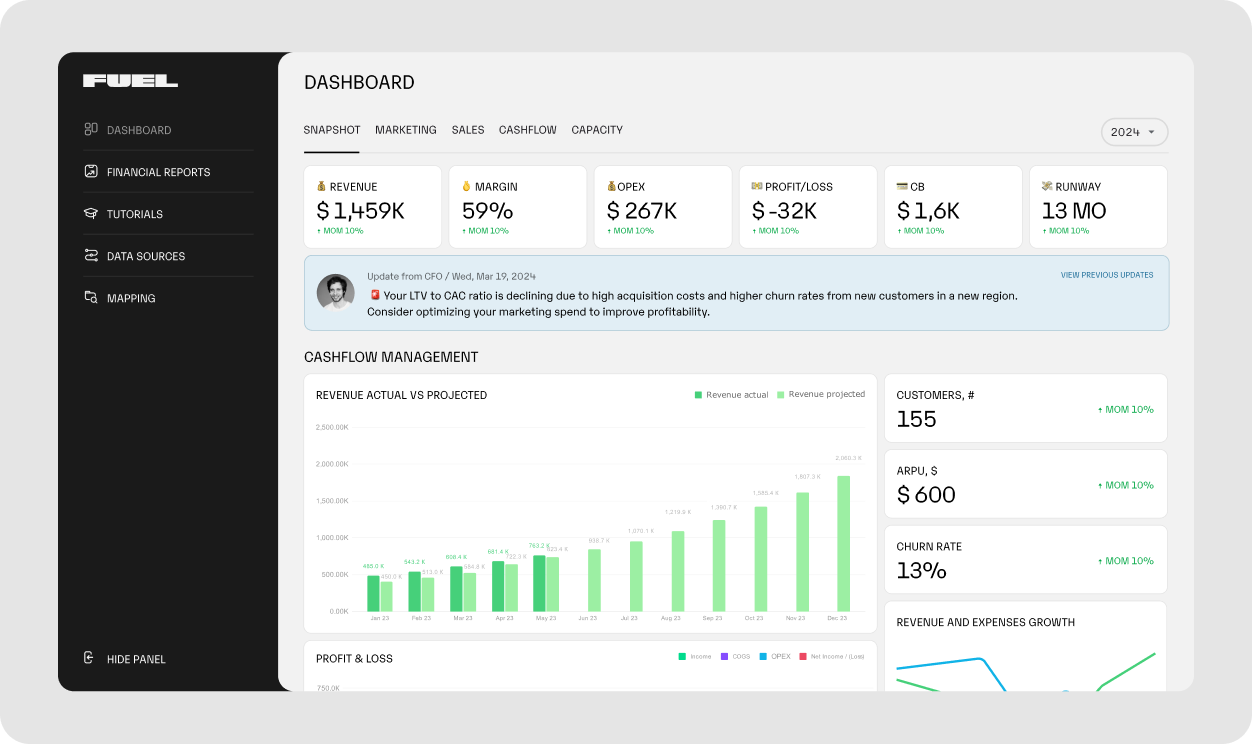
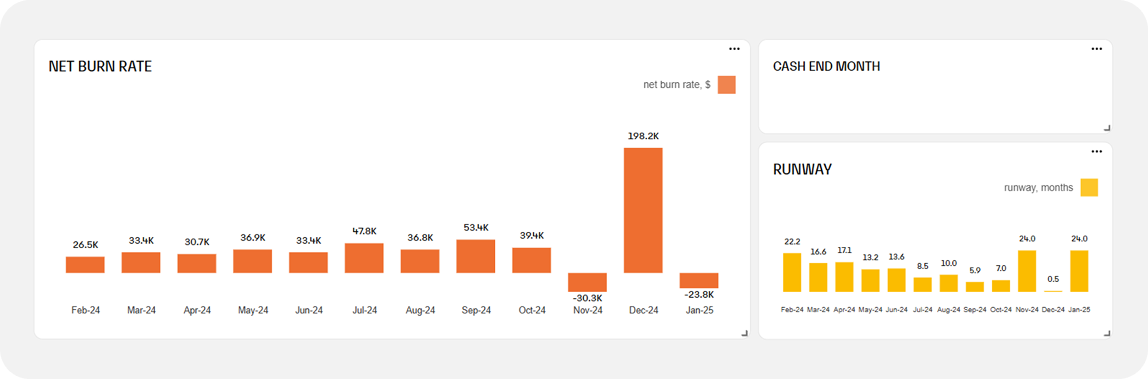
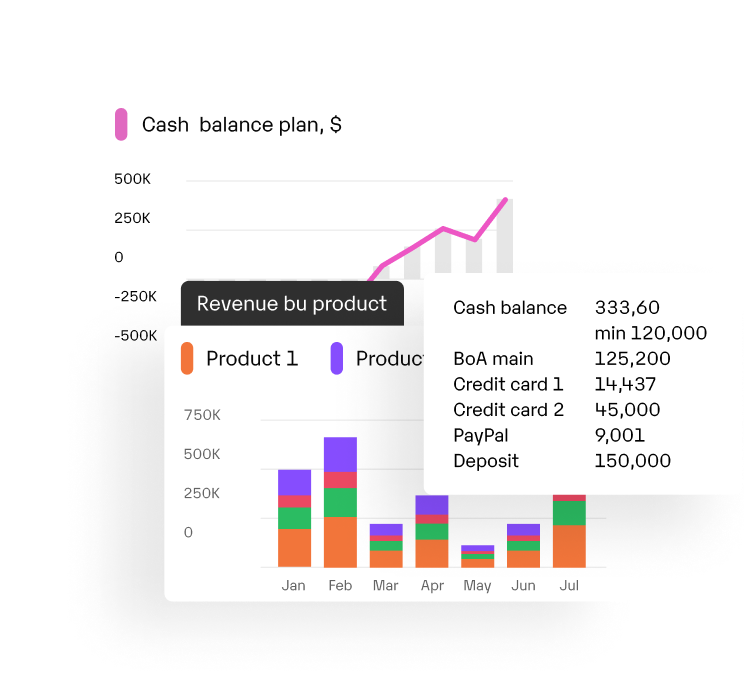
The Fuelfinance dashboard gathers all essential financial metrics into a single, user-friendly interface, helping businesses monitor their financial health. Feel free to interact with various graphs and charts, clicking on any element to delve deeper into the underlying data. Developed based on insights from over 600 small and medium-sized businesses, the dashboard tracks the most relevant metrics for your operations.
Here are just some examples of the dashboard insights you get:
Fuelfinance connects with over 300 tools, including QuickBooks, Xero, Brex and Stripe. It also has a HubSpot and Salesforce integration.
Interested? Sign up for a short demo call to see how we can help you keep your finances in check.
Fuelfinance is rated 4.9 out of 5 on G2. But here’s a more up-close and personal case we helped solve, to give you a better idea of what it’s like to fuel your finances.
ColdIQ, a growing GTM agency, used Fuelfinance to improve its financial management. Before using Fuelfinance, they struggled with scattered data and manual processes. With our centralized dashboards and AI-driven insights, they gained real-time financial visibility, which let them optimize their revenue streams and improve decision-making. Within 8 months, ColdIQ saw a 236% revenue growth, going from $67K to $250K MRR. The platform also sped up their financial reporting process, reducing the time to close books from 25 days to just 10.
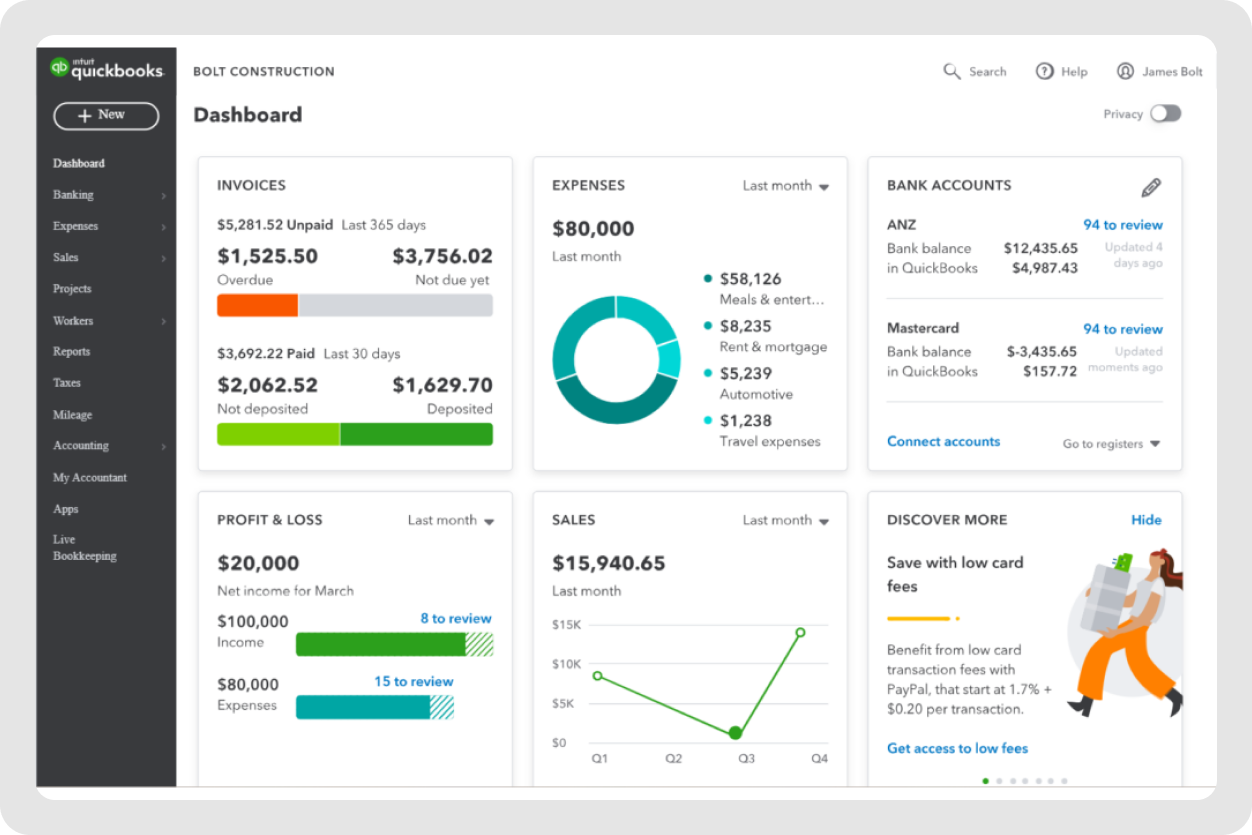
QuickBooks provides a dynamic financial dashboard that gives businesses an overview of key financial metrics, including income, expenses, cash balance, tax liabilities and profit trends. The dashboard features customizable charts and graphs that highlight financial performance. The key benefits of this financial management solution include real-time reporting, simplified tax tracking and automated financial management. Some helpful QuickBooks integrations include platforms like PayPal, Shopify and Square.
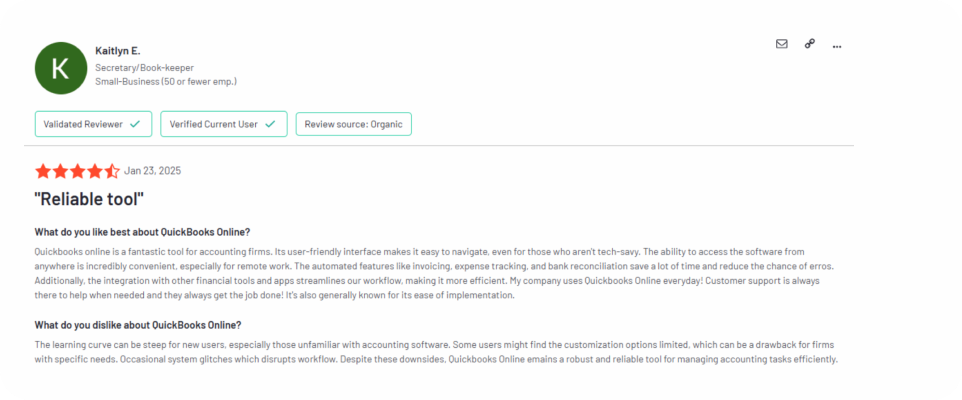
QuickBooks is rated 4.0 out of 5 on G2.
Read also: Best QuickBooks Alternative for Small Businesses: 6 Top Picks
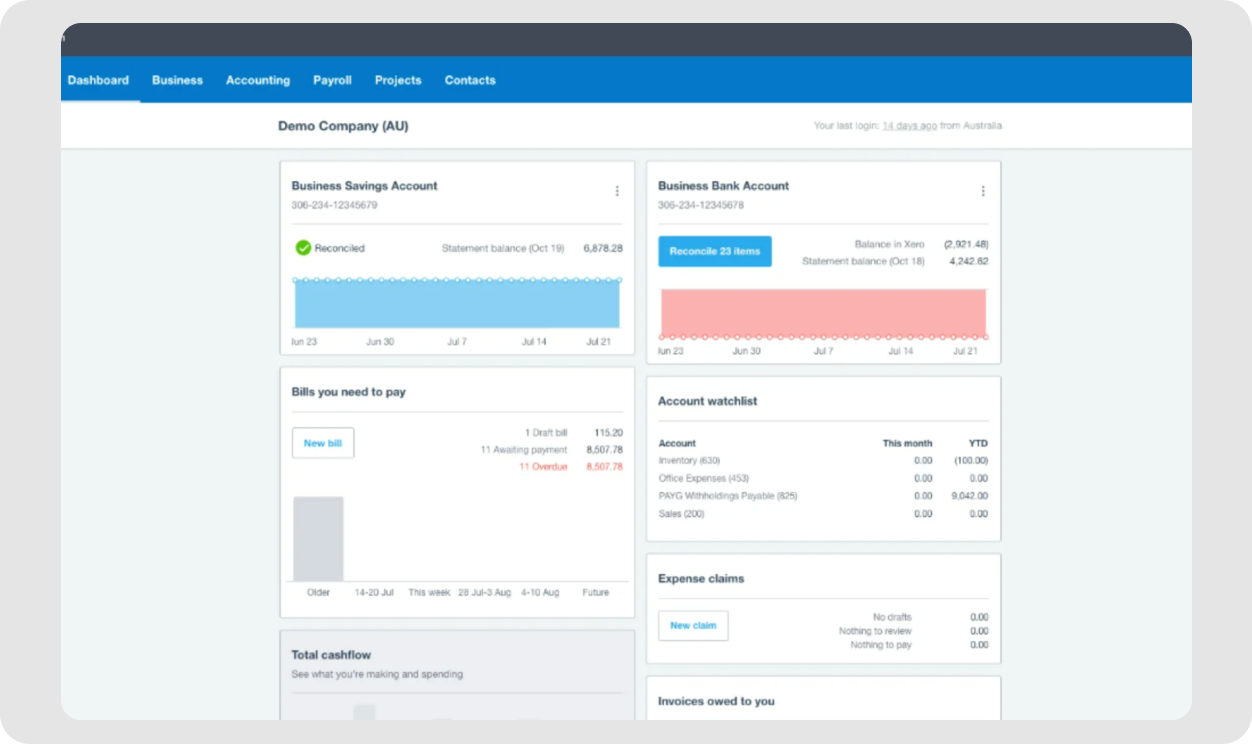
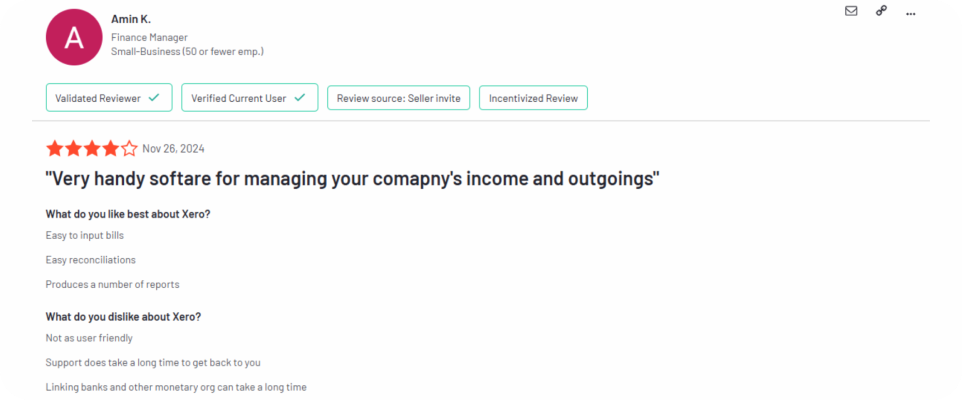
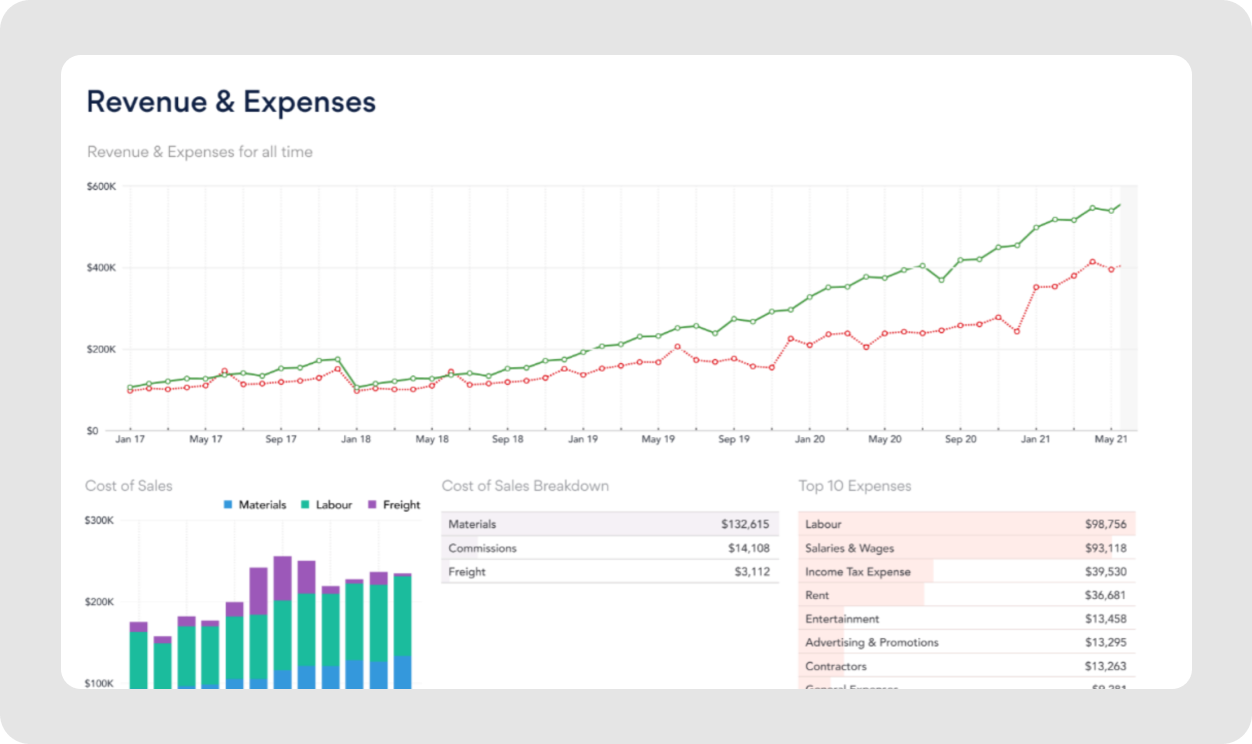
The Xero financial dashboard provides a real-time snapshot of a business's financial health. Users can track bank balances, invoices, cash inflows/outflows and overdue payments. This business budgeting software provides automated invoicing, expense tracking and cash flow forecasting.
Xero integrates with Stripe, PayPal, Shopify and other third-party apps.
Read also: Xero vs. Quickbooks: Which is the right one for our business?
Xero is rated 4.3 out of 5 on G2.
Read also: Find the Best Xero Alternative for You
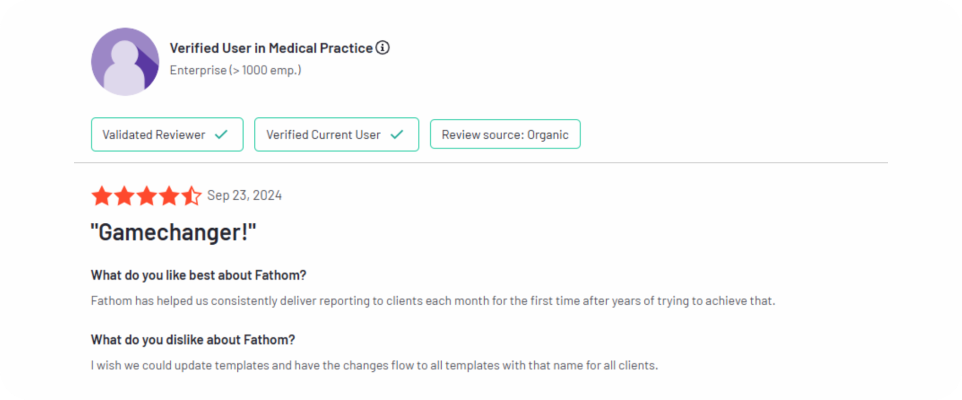
Fathom financial performance dashboard offers visual, customizable reports with charts and KPIs, providing a view of profitability, cash flow, industry benchmarks and financial health scores. The platform provides users with detailed financial analysis, performance benchmarking and forecasting tools. It integrates with Xero, QuickBooks and MYOB.
Fathom is rated 4.5 out of 5 on G2.
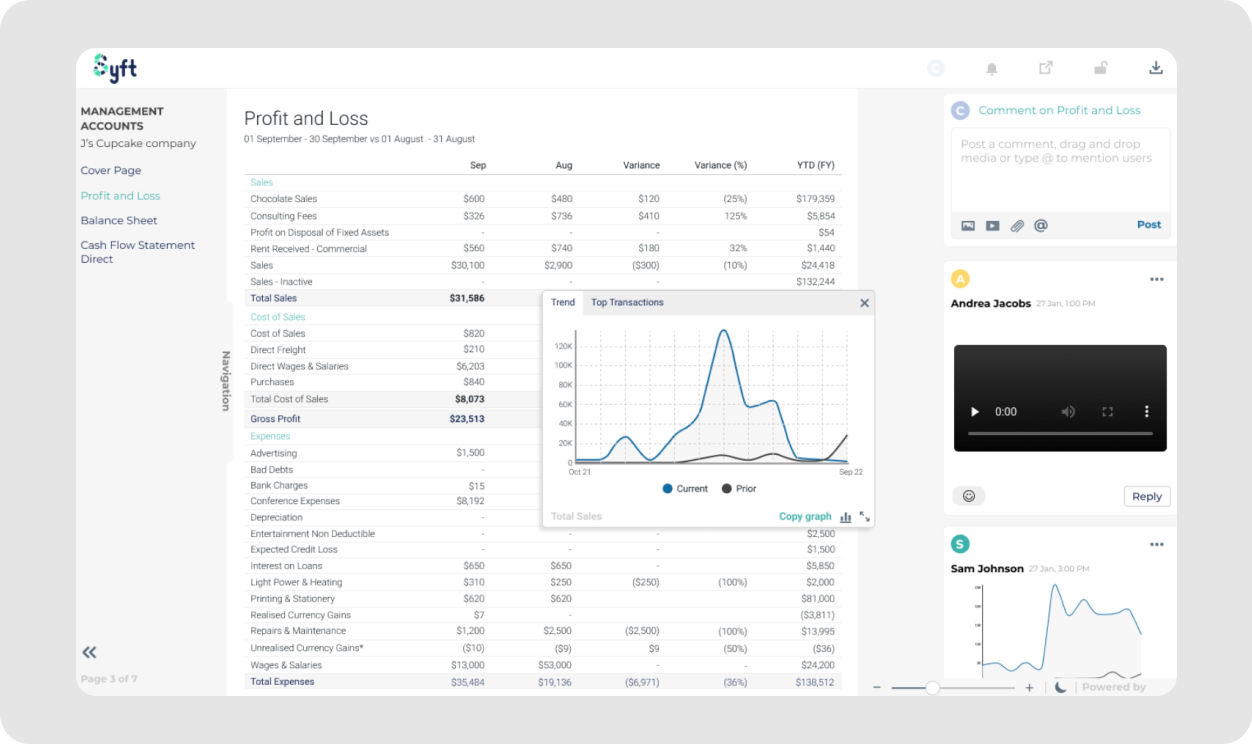
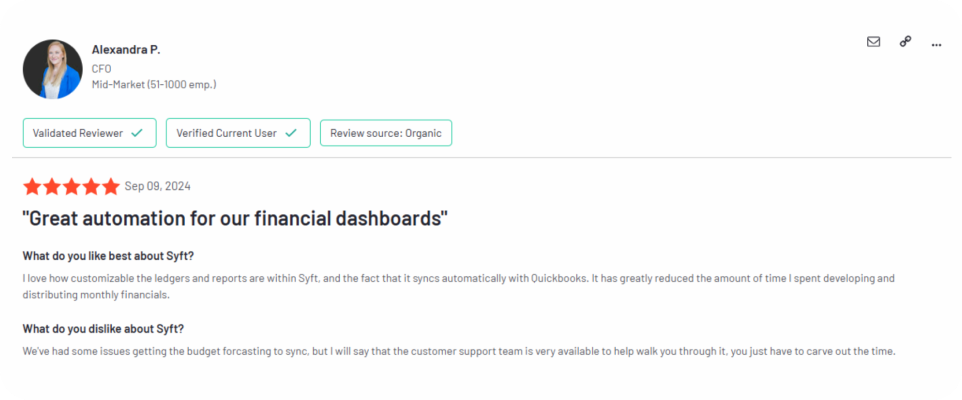
Syft Analytics is a financial planning software that generates customizable reports with graphs and forecasts, simplifying complex financial data into visuals. It lets users track revenue trends, financial variances and real-time performance analysis. Syft Analytics integrates with platforms like Xero, QuickBooks Online, Sage Business Cloud, Excel and Stripe.
Syft Analytics is rated 4.8 out of 5 on G2.
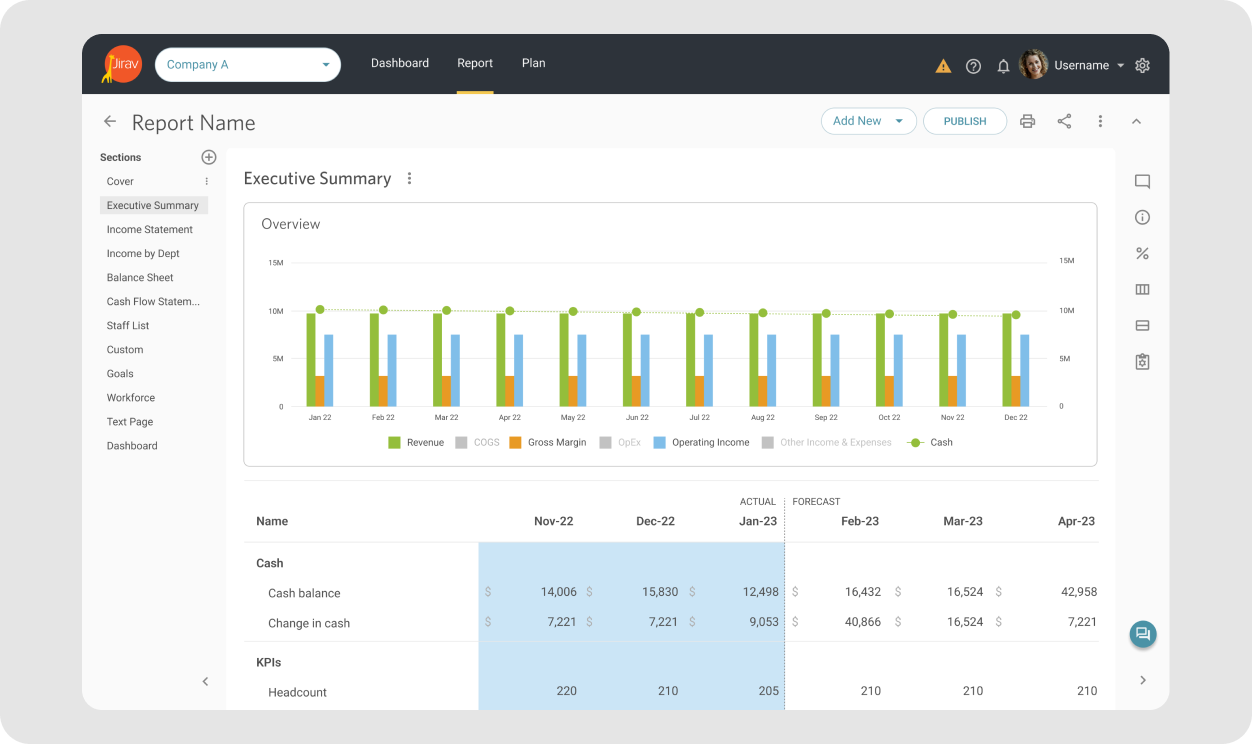
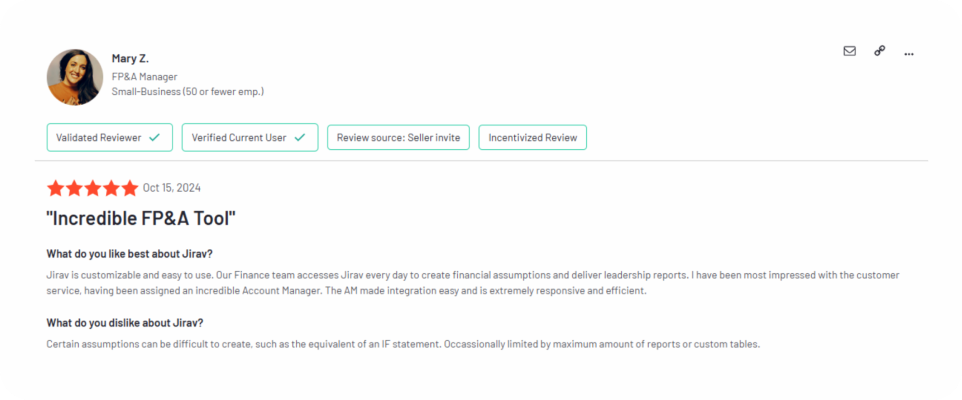
Jirav is a financial planning and analysis platform helping businesses and accounting firms with dashboarding, budgeting, forecasting and reporting. By integrating financial and operational data, Jirav lets organizations create dynamic financial models and visualize performance metrics in real time, helping them track financial forecasts, scenario planning and expenses.
The tool integrates with QuickBooks, Xero, NetSuite, Sage Intacct and Excel, among other tools.
Jirav is rated 4.7 out of 5 on G2.
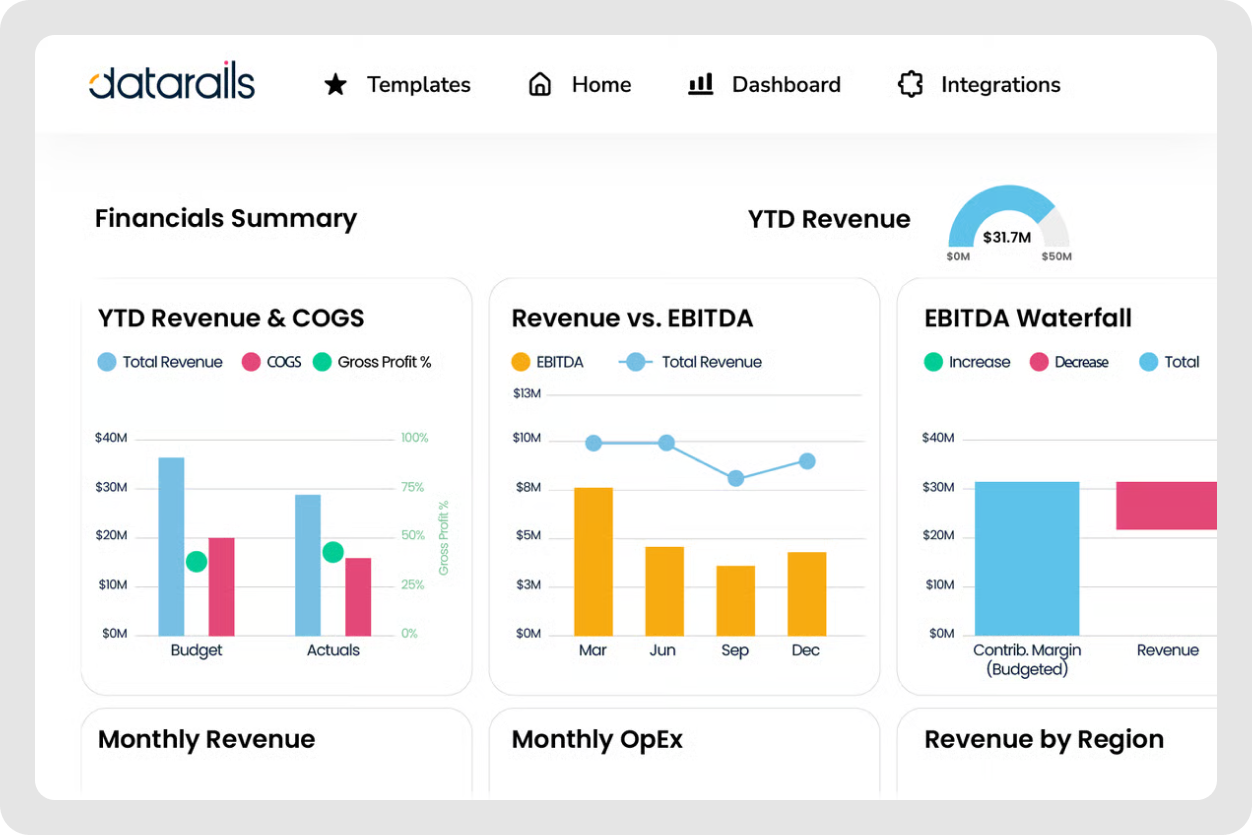
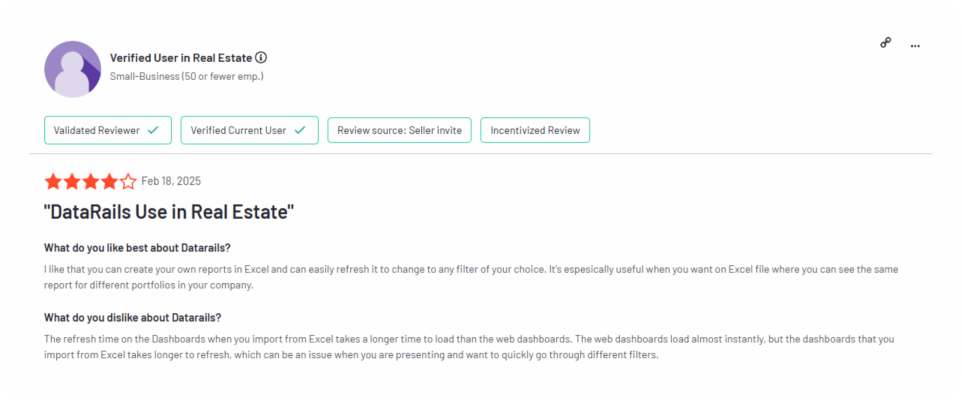
Datarails has a versatile financial dashboard providing organizations with real-time insights into their financial performance. By connecting data from different sources, it lets users monitor key metrics such as revenue versus expenses, variance reports and profit and loss (P&L).
The tool provides interactive dashboards, featuring various chart types such as bar charts, line graphs and pie charts. Users can apply filters and drill down into underlying data for more detailed analysis. The drag-and-drop interface simplifies the creation and modification of visualizations.
Datarails integrates with tools such as NetSuite, Microsoft Dynamics 365 Hubspot, Saleforce and Shopify.
Datarails is rated 4.6 out of 5 on G2.
Read also: 6 Best Datarails Competitiors and Alternatives for 2025
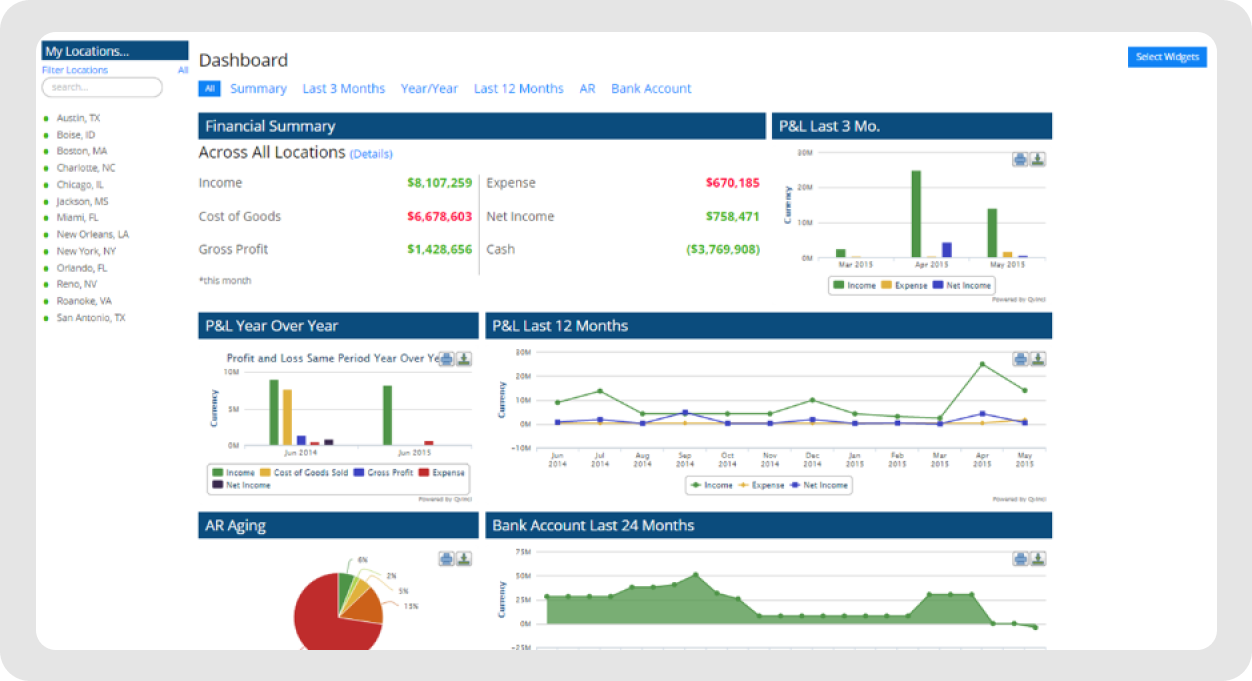
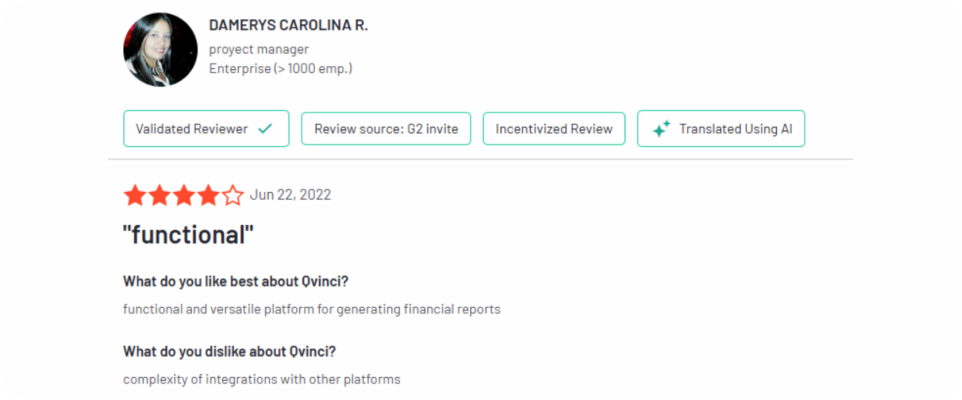
Qvinci is a financial reporting and business intelligence platform that automates financial data consolidation, reporting and analysis for businesses, especially those operating across multiple locations or franchises. The dashboard presents graphical representations of financial data, displaying key performance indicators and financial metrics across various entities or locations.
The tool integrates with QuickBooks, Xero, MYOB, Excel and more.
Qvinci is rated 3.5 out of 5 on G2.
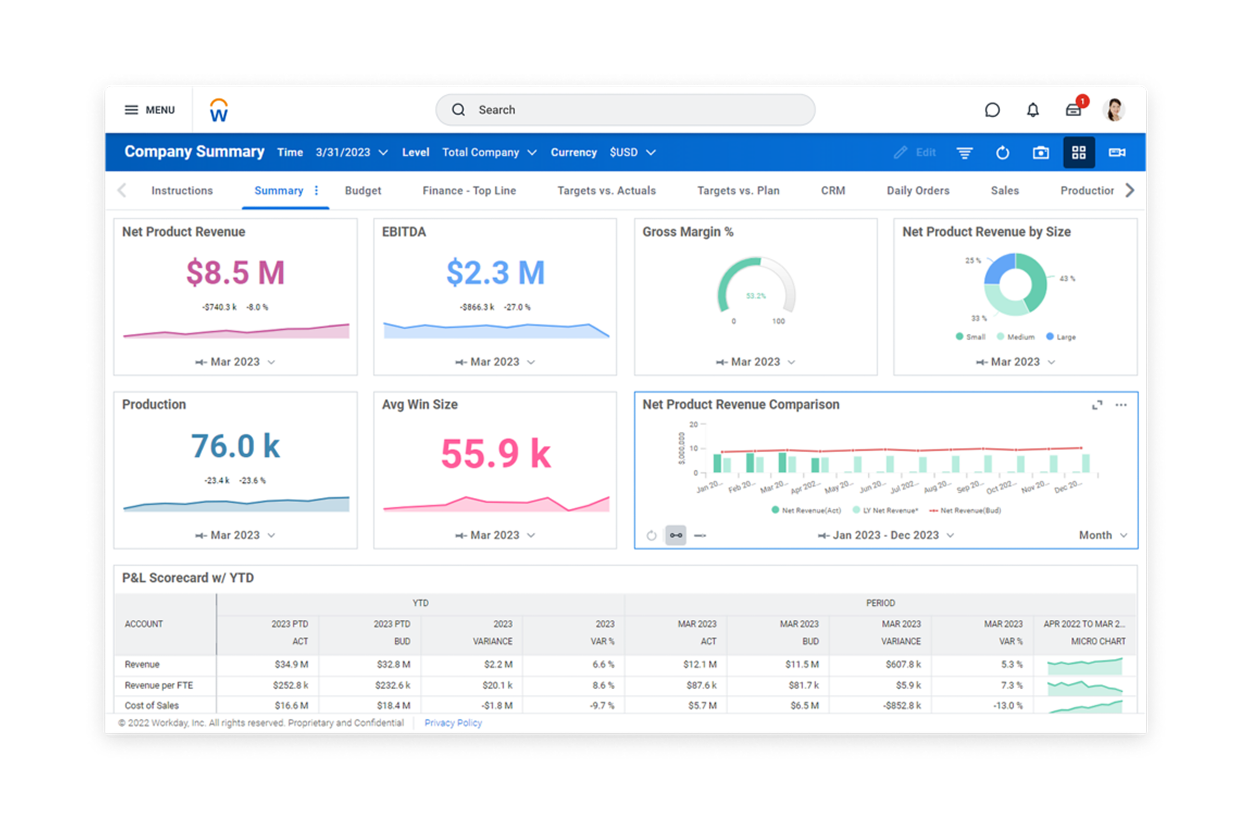
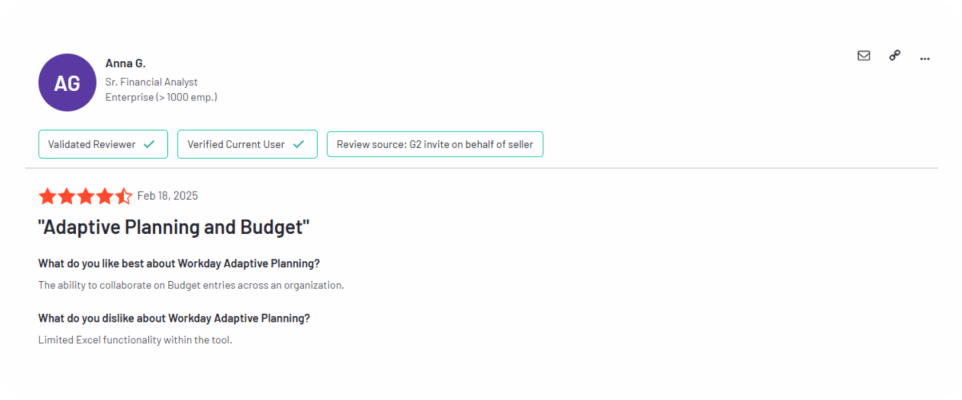
The Workday Adaptive Planning dashboard includes interactive visualizations such as charts, graphs and scorecards that display key financial metrics like revenue, expenses and profit margins. These visualizations can be set up to show data across actual and planned versions. The dashboards update in real time and let users track corporate budgets, revenue forecasts and workforce expenses.
The platform integrates with tools like Oracle NetSuite, Sage Intacct and Salesforce.
Workday Adaptive Planning is rated 4.3 out of 5 on G2.
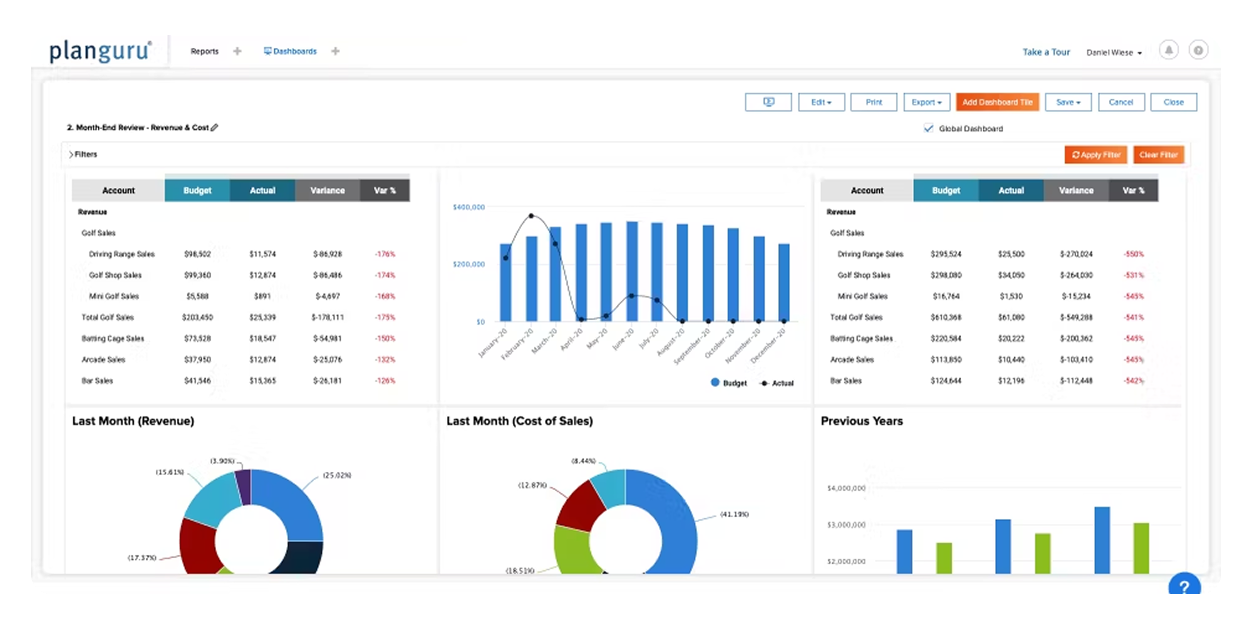
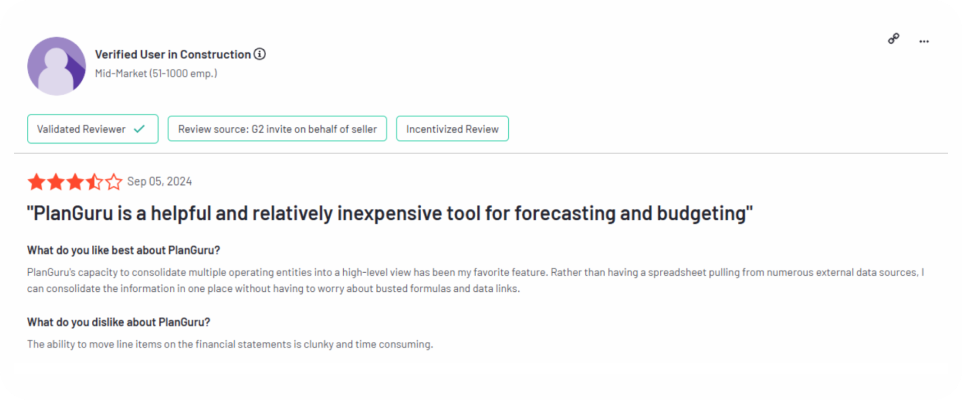
The PlanGuru financial dashboard displays key performance indicators and tracks budget deviations, financial forecasting and cash management. The tool provides visualizations such as pie charts, bar graphs and line charts for income statements, balance sheets and cash flow statements. PlanGuru reduces manual work through automated forecasting methods and formula builders.
The platform integrates with QuickBooks Online, Xero and Excel.
PlanGuru is rated 4.5 out of 5 on G2.
Financial dashboard toolDashboard featuresBest for G2 ratingFuelfinanceP&L tracking
Cash flow
Opex vs. Revenue Growth
Unit economics
Revenue and expenses
Scenario planning
Burn rate and runway
EBITDA & Net Profit
Projected vs. actualSaaS companies, SMBs and growing companies in all industries4.9QuickBooksIncome tracking
Expenses
Cash balance
Tax liabilities
Profit trendsAccounting and bookkeeping firms, SMBs and startups4.0XeroBank balance tracking
Invoices
Cash inflows/outflows
Overdue paymentsAccounting and bookkeeping firms, SMBs, sole proprietors and freelancers4.3FathomProfitability tracking
Cash flow
Industry benchmarks
Financial health scoresCFOs and finance teams, SMBs4.5Syft AnalyticsRevenue trends tracking
Financial variances
Real-time performance analysisCFOs and financial analysts, SMBs4.8JiravReal-time financial forecasts
Scenario planning
Expense trackingCFOs and financial planning teams, SMBs4.7DatarailsRevenue vs. expenses tracking
Variance reports
P&L performanceCFOs and financial planning teams, mid-sized to large businesses4.6QvinciConsolidated financials tracking
Regional revenue performance
Multi-location trackingMulti-entitity businesses and franchises, SMBs3.5Workday Adaptive PlanningCorporate budget tracking
Revenue forecasts
Workforce expensesHR, finance and operations teams, SMBs and large enterprises4.3PlanGuruCFOs and finance teams, SMBS and multi-departmental organizationsCFOs and finance teams, SMBS and multi-departamental organizations4.5
Managing business finances doesn't have to feel like a constant struggle. The right financial dashboard lets you take full control of your numbers; it provides a visual representation of key financial insights, helping you track, analyze and manage your financial performance.
With Fuelfinance, you can skip manual spreadsheet updates, complex calculations and financial guesswork — letting automation and AI handle the heavy lifting while you focus on growing your business.
If you want to try a tool that provides real-time financial reporting, tailored KPIs and expert-backed insights, book a Fuelfinance demo.
READY FOR FINANCIAL
P😌ACE OF MIND?
See what Fuel can do
for your biz.
Such a dashboard is a visual tool that tracks, analyzes and manages financial data, ideally in real time. It consolidates key financial metrics and presents them in an easy-to-read format, often using graphs, charts, and key performance indicators. The key features of a financial dashboard include:
To create a financial dashboard, follow these steps:
A CFO dashboard is a high-level financial dashboard that provides Chief Financial Officers (CFOs) with real-time insights into a company's financial status. It usually includes key financial metrics, interactive charts and trend analysis to support strategic decision-making. The dashboard can also include heatmaps and scorecards for quick comparisons of KPIs and interactive filters to drill down into specific periods or departments.
The best financial dashboard app is Fuelfinance because it combines advanced technology and in-depth financial planning and analysis with the human touch — it provides access to financial experts who act as dedicated outsourced CFOs. This personalized support assists businesses in financial planning, forecasting and decision-making.
Fuelfinance takes a personalized approach to KPI tracking by recommending metrics based on your business model (SaaS, e-commerce, or services). This ensures you're always focused on the most relevant metrics to your specific business goals.