Unfortunately, there's no school for future business owners and no one shows you how to read a profit and loss statement. You’re just somehow expected to do it.
Yet, it's so easy to get lost in all those figures, especially if you don't have a background in managing business finances and don't know what to look for.
At Fuelfinance, our mission is to make finance simple and accessible to everyone, as it should be. That's why we've created this guide on how to read a profit and loss statement and analyze it to improve your financial performance.
Here are two rules we always keep in mind when reading the profit and loss statement financial statement:
According to accrual accounting principles, revenue should be recorded not when cash is received but when goods are delivered or services are performed. This principle ensures the transaction is finished and the income is accurately reported.
Also, you should record expenses when they're billed, no matter whether you actually pay them before or after. Doing so ensures that all your small business financial statements (in this case, a profit and loss statement) show the actual value of the goods and services a company provided during a specific period.
To get an accurate reading and even more insights into your P&L statements, it's always a good idea to compare them with the following:
There's no need to hire an outsourced CFO to help you read your profit and loss statement. However, most guides on this topic are written for professionals and sound way more complicated than it actually is.
That's why we created a “how to read a P&L for dummies” guide to show you that everyone can do it, even without prior experience.
Before explaining how to analyze a profit and loss statement, let’s distinguish between venture-backed companies that should analyze revenue and profit-generating businesses that should focus on net income.
Venture-backed companies are usually startups with different SaaS financial models that get money from investors at various stages, like early seed funding and later growth funding, whereas profit-generating businesses are companies that have more revenue than expenses.
The former should analyze revenue by performing Plan/Actual analysis and Month-over-month (MoM) changes in income. Additionally, they can analyze revenue by revenue streams, average price per unit or user, number of customers, users and products etc.
The latter should analyze net earnings by performing analyses similar to those of venture-backed companies. They can analyze the net revenue by comparing it with free cash flow or calculating the difference between cash and profit.
Month-over-month (MoM) comparisons analyze how a specific financial metric changes from one month to the next. Businesses track MoM to spot trends, find patterns and monitor changes over time.
MoM analysis can be applied to almost all key SaaS metrics, such as sales, profits, customer numbers and operating expenses.
The main focus of MoM analysis is to calculate the percentual change between the two months (both in terms of revenue and expenses), which helps show whether the metric is increasing, decreasing or staying the same.
Let’s illustrate this with some examples.
For the revenue part, consider both your recurring revenue and one-off payments.
If your business has multiple revenue streams, you shouldn’t focus only on your overall revenue dynamics but also on the changes that happened from month to month for each stream and be able to explain those changes.
Perhaps you canceled or changed one of your products. Or maybe you noticed a significant growth in one of your revenue streams linked to your marketing and sales efforts from the previous period.
On the other hand, you must also analyze whether your expenses changed or increased and why, but we’ll explore that further in the next section.
If some of your expense categories significantly increased, that’s not necessarily a reason to panic. The main point is that you should be able to explain all the MoM changes and fully understand what stands behind them. That’s all.
Finally, after considering both revenue and expenses, you should be able to see how your bottom line has changed from month to month. We’re talking about EBITA (earnings before interest, taxes and amortization) or your MoM net income.
The main goal is to see whether there’s a predictable change in line with your expectations, budget and financial forecast.
It’s essential to regularly identify your biggest expenses incurred and see how they change each month. This helps manage costs, plan budgets, lower risks and, of course, increase gross profit.
Here are some of the most significant expenses you should pay attention to when analyzing your P&L statement:
Analyzing the most significant differences between what you planned or budgeted and what actually happened, as shown in your profit and loss statement, helps you see how well your business is doing compared to your goals.
Many businesses set stretch targets and often don’t reach revenue, net income or gross profit margin budget.
If there's a big difference between your goals and what you achieved, don't worry. That's expected, especially if you have limited experience in financial forecasting. The only way to get better at small business financial planning is to start doing it, and your projections will be more accurate each time.
The crucial part is seeing why you haven’t reached your goals and targets and what you need to change to align them with your budget in the following months.
Understanding these differences lets you make wise decisions and improve how you manage money, plan for the future and show investors that you're on top of things. Also, good financial modeling software can help you prepare for all potential future scenarios so that nothing can surprise you.
When talking about plan vs actual analysis, most founders focus on profit that hasn’t been achieved. But what if you find that you actually have some spare funds in your budget?
It sounds great, but it doesn’t have to be. Let’s say you’ve budgeted $20,000 for marketing expenses every month. And you see that you’re spending only $5k on marketing instead of $20k.
In this case, not using the whole budget doesn’t necessarily mean you’re saving money. It can have a negative impact on the final results. Simply put, if you don’t spend enough on marketing, you might not generate enough sales to meet your revenue target.
Therefore, plan vs actual analysis also helps you spot categories where you aren’t spending enough according to the budget and your overall business strategy – which often gets overlooked. At Fuelfinance, we give you recommendations about where you should spend more and where you should cut costs to help you budget wisely and reach your goals (but more on that later).
Now that you have these insights, you should use them to plan the upcoming month. This means doing a financial forecast or a monthly budget review.
We see many businesses fail to do this, sticking to yearly plans and creating budgets only once a year without ever revisiting them. That’s a big mistake as markets are volatile, and after a couple of months, the initial budget you’ve created at the beginning of the year might no longer be reasonable.
For example, you may have set a very ambitious revenue target in December. You blink, and suddenly, it’s July, and your business hasn’t reached that target yet, and it seems unlikely you’ll even get close any time soon.
Don’t worry, though. Now that you know that, you can review your goals accordingly and keep the stretch target for the whole year, but also maintain a baseline budget and set minimum targets to see how your business performs and whether you can hit them first.
If you don't want to do this manually, financial planning software tools like Fuelfinance can help you automate the process.
You should analyze your P&L reports every month, ideally by the fifth day. Don't panic – it usually takes less than an hour, and it'll save you a lot of time and effort in the long run.
If your monthly closing period is longer, doing it after the fifth is okay. However, you shouldn't wait 20-30 days after the month ends, as it'd be too late to start planning and making decisions for the following month. Starting earlier ensures you have the information to plan effectively and stay on top of your finances.

Why create financial statements manually and bother with spreadsheets when there's a way to automate it?
Our tool can help you do so, plus more! Fuelfinance software specializes in startup and small business financial management.
In addition to a reliable tool, you'll also get unlimited support from our team of financial experts. We assist in reading your P&L statements and ensuring you meet all the necessary criteria for recognizing revenue.
Here are some of the main features of our software:

If you’re in the pre-seed stage and don’t have the budget for our full package, we’ve got you covered.
We want to introduce you to Bootstrap, our free financial management solution for startup founders in the early stages, even before securing funding. Bootstrap simplifies your finances and generates professional reports that impress investors.
You can use it to generate three essential financial statements completely free! If you want to avoid manual data entry, you can use QuickBooks integration to automate your financial statements for only $39 per month.
Here's what you can also get for free (no hidden costs):
At Fuelfinance, we know how tough it can be to start a business. On top of everything, you now also have to deal with financial data you never signed up for.
That’s why we created a simple financial tool for small businesses and startup owners. With it, you can easily manage your business finances and generate P&L and other financial statements, even if you’re not a finance expert.
Plus, our finance professionals are here to support you. That includes guidance on how to read a P&L statement and maximize your profit.
Book a demo now to see how Fuelfinance can automate your finances, making your business run smoother.
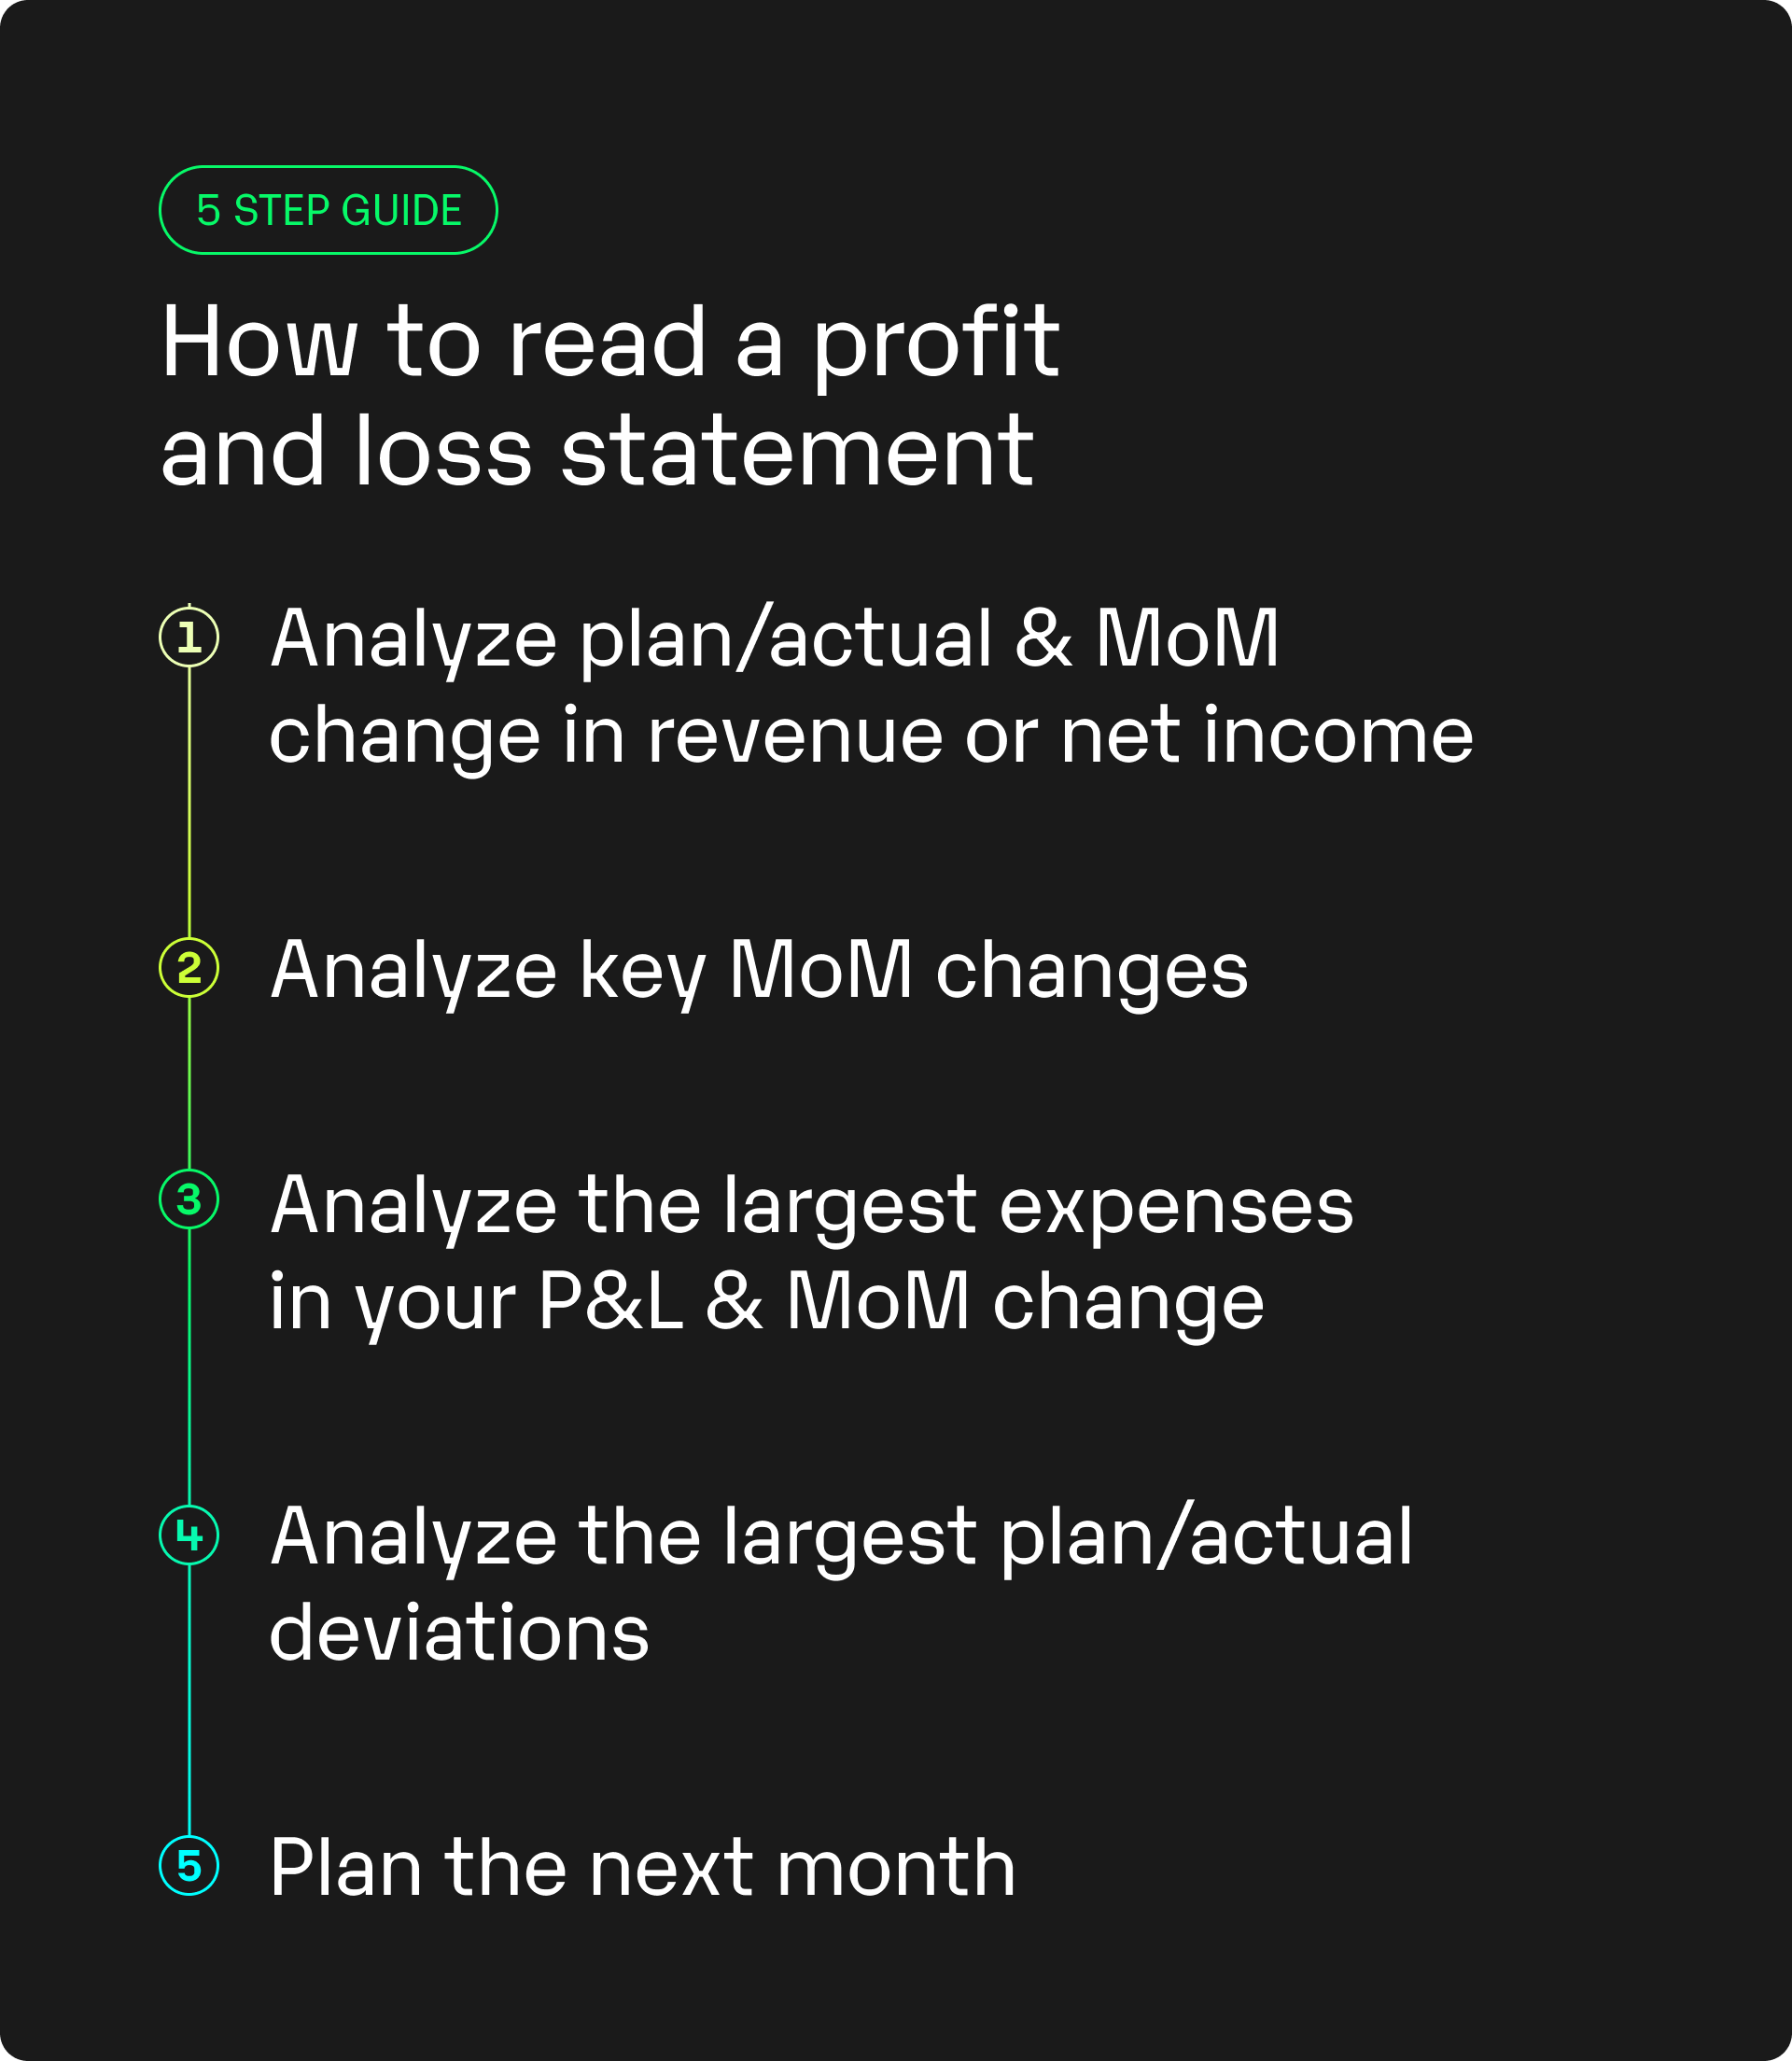
Start by analyzing plan/actual and MoM revenue or net income changes. You should especially focus on discovering any significant deviations and determining your biggest expenses. Then, compare your actual financial performance with your plans (by doing a plan vs actual analysis). Use those insights to create a financial plan for the next month.
The key is to compare your company's revenues with its expenses. Calculate your total revenue and subtract all the costs to get your final net profit. You don't have to do this manually, as there are many tools that can help you automate the process.
To summarize your P&L statement, look at the total revenue at the top and the final net income at the bottom, which shows your actual profit after total expenses are detracted. You can also focus on key expense categories like COGS, operating expenses or taxes.